

Human Capital Management Data of the Panasonic Group
The Panasonic Group is driving the five transformative actions aimed at becoming a company where every employee can ‘UNLOCK’ their full potential. In this page, along with key data on our people and ways of working, we provide insights into the progress of our key initiatives: “Develop & Appoint Transformational Leaders,” “Organization Culture Transformation,” “Promotion of DEI (Diversity, Equity & Inclusion),” and “Transformation in HR Function (Utilization of AI).” For “Creating a Safe, Secure, and Healthy Workplace,” please visit Sustainability Data Book webpage.
*Definition of terms used on this page:
- Definition of the Japan Region: The companies included in the Japan region vary depending on the reporting period. For details, please refer to this page.
- The term “employees” is used here to refer to both employees with no fixed term of employment and fixed-term employees.
- Figures for Japan region: Unless otherwise indicated, these figures refer to employees with no fixed term of employment and fixed-term employees.

1. Basic Information
(Human Resources/Work Styles)
Human Resources

Number of employees (Global):
183,658
183,658
As of March 31, 2026
By region (Global)
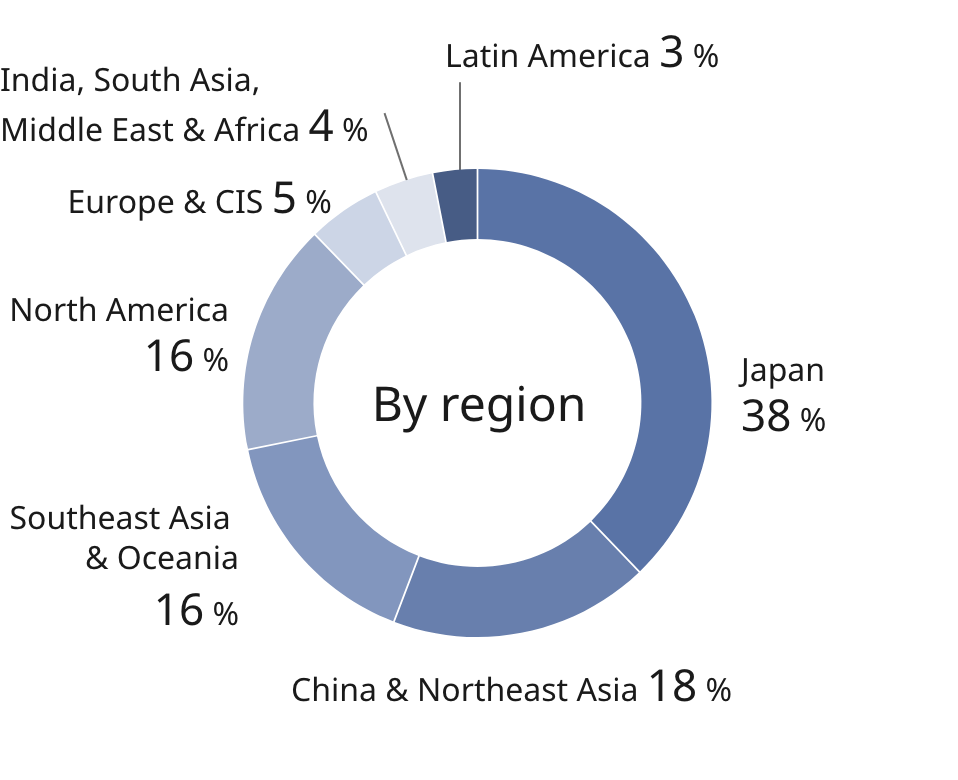
As of March 31, 2026
By job type (Japan region)
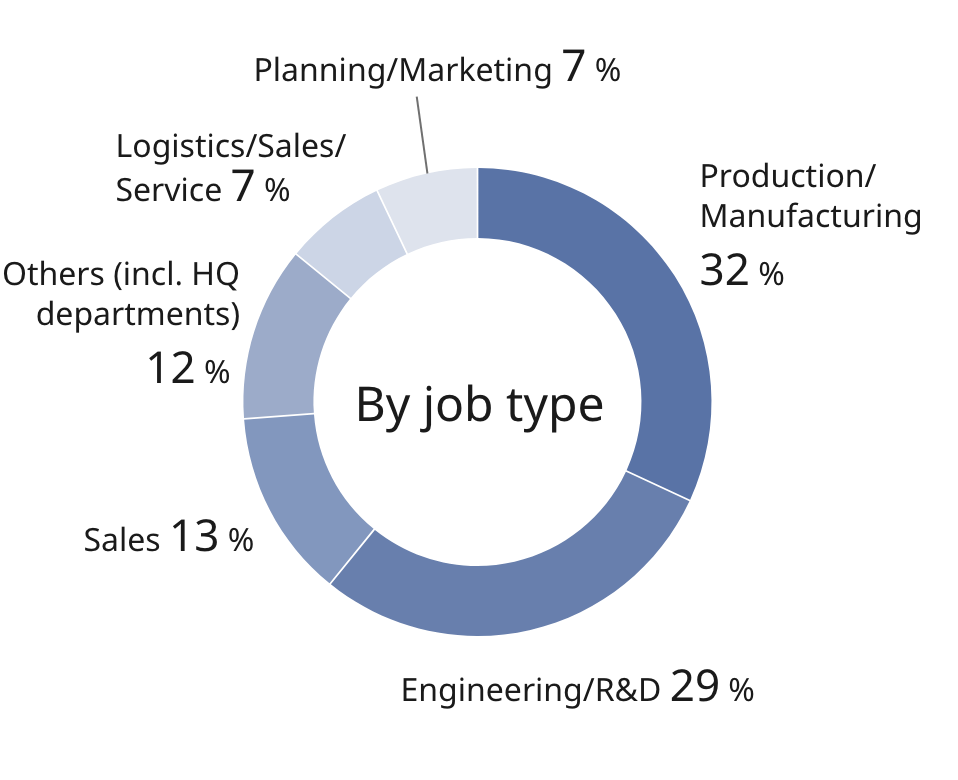
As of April 1, 2026
By gender (Japan region)
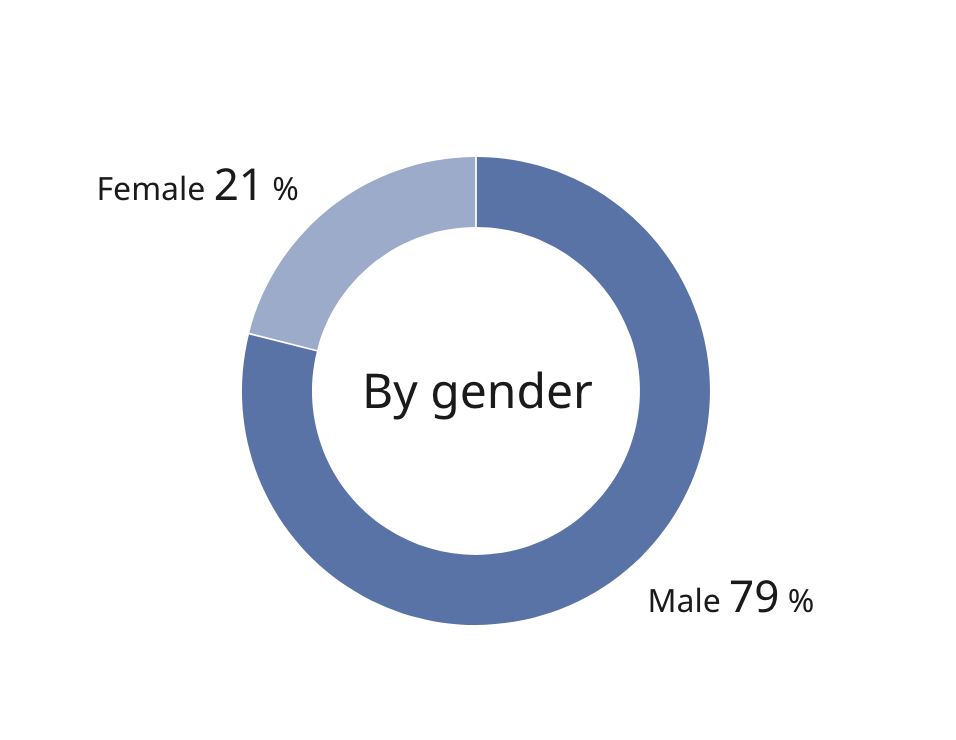
As of April 1, 2026
By age group (Japan region)
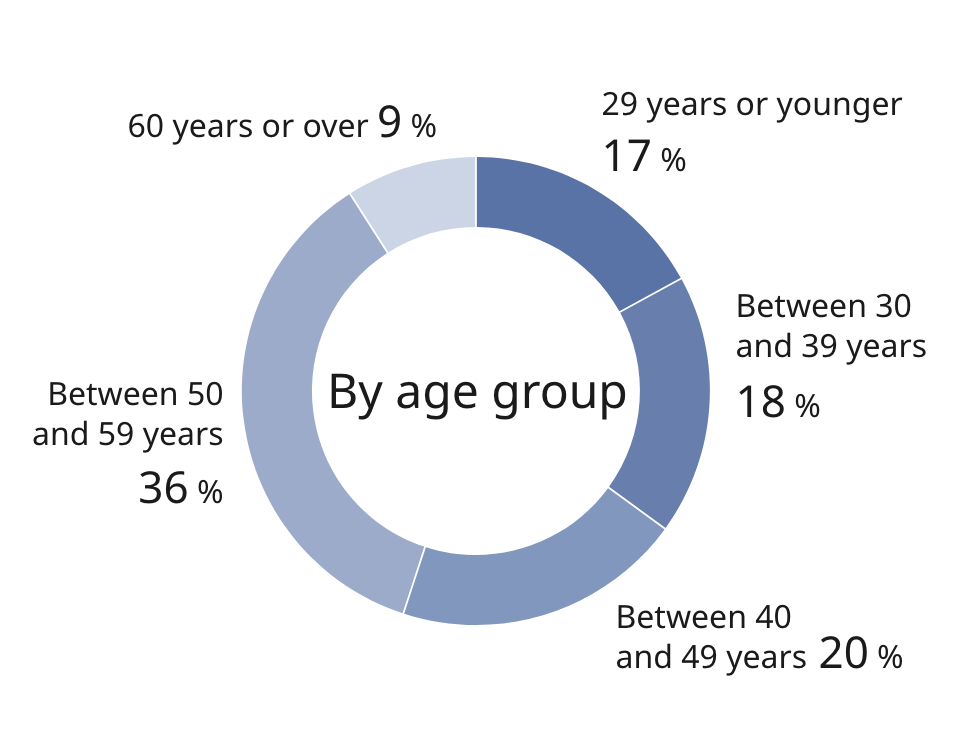
As of April 1, 2026
Number of persons recruited (Japan region)
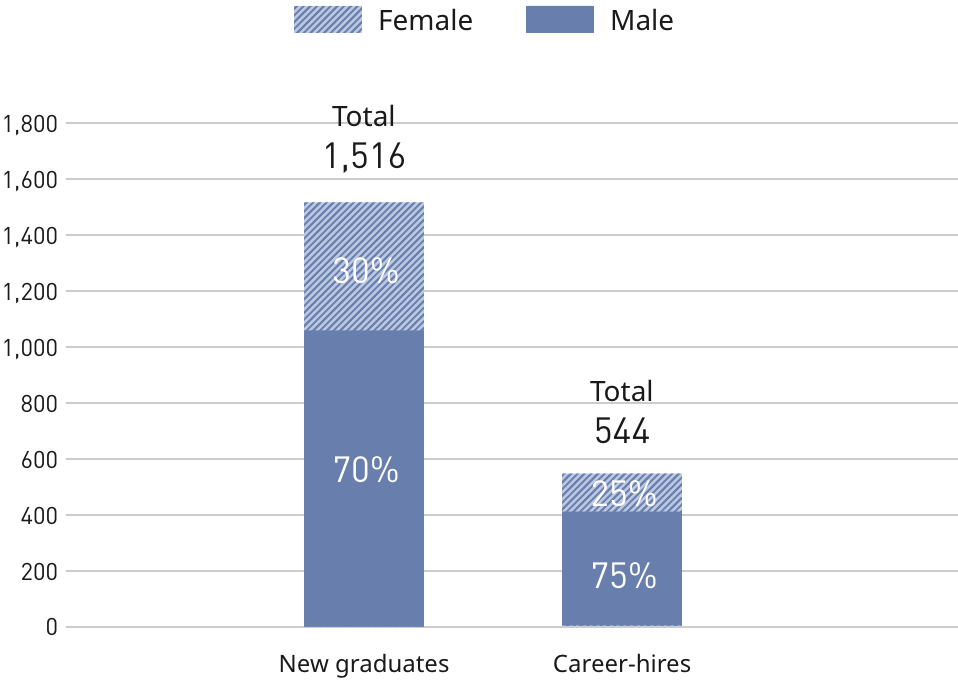
FY 2026
Turnover rate* (Japan region)
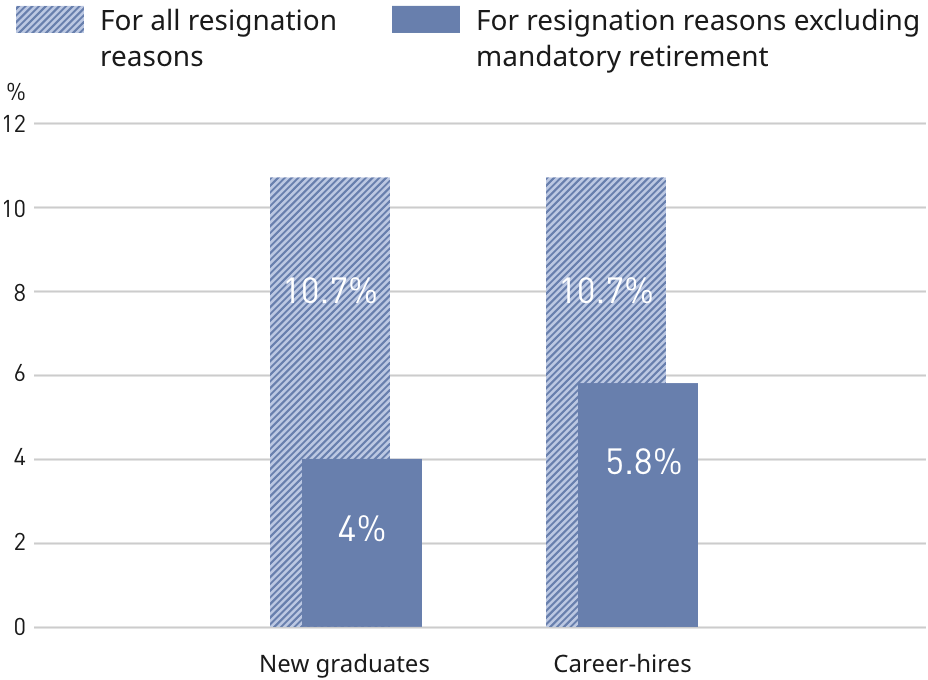
FY 2026
*The number of those leaving the Group per year divided by the annual average number of employees (employees with no fixed term of employment)
Work Styles
Options for When and Where to Work (Japan region)
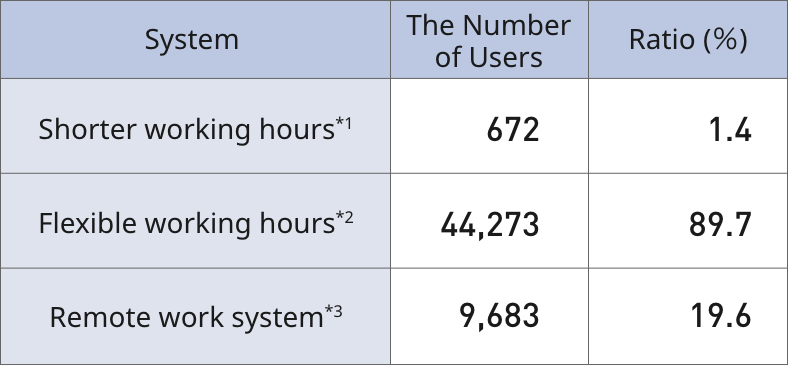
As of April 2026
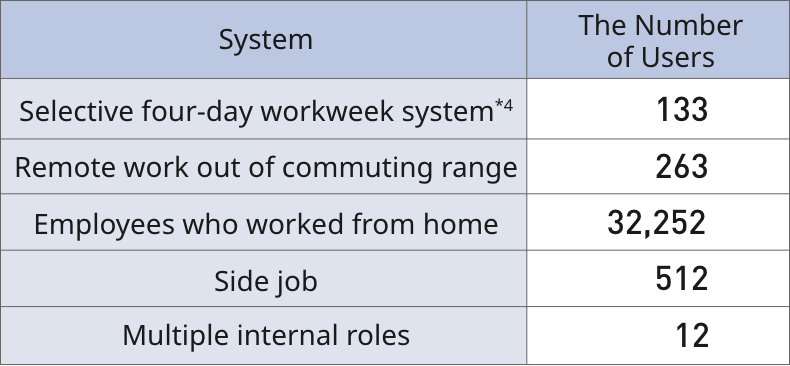
FY 2026
*1: The internal system is called the Work and Life Support System.
*2: Employees who have adopted a flexible work arrangement.
*3: Employees who work remotely at least half of the days in a given month.
*4: Employees who have used the four-day workweek system at least once during the fiscal year.
- We provide a work environment with a variety of work style options to help each individual maximize their strengths.
- For details, please refer to “Support for Every Individual: Diverse Work Styles and Work-Life Balance” and “Examples of Diverse Work Styles.”
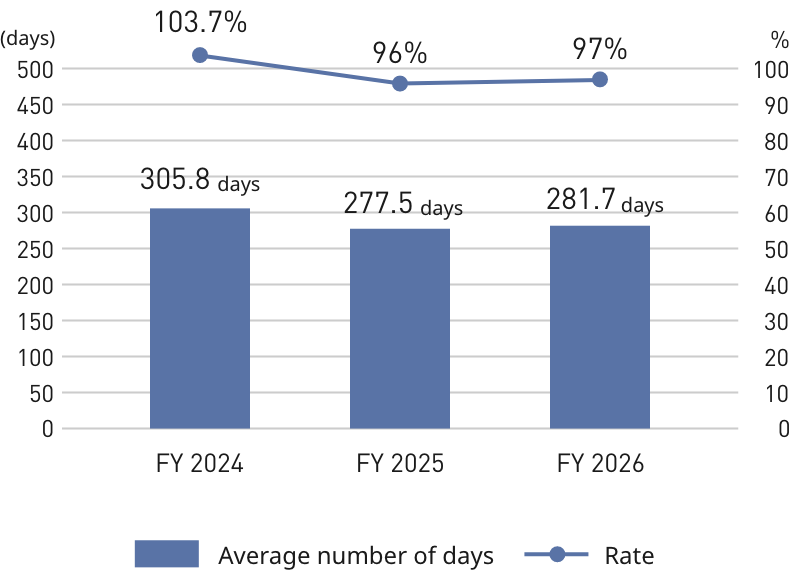
Number of days and rate* of annual paid leave taken (Japan region)
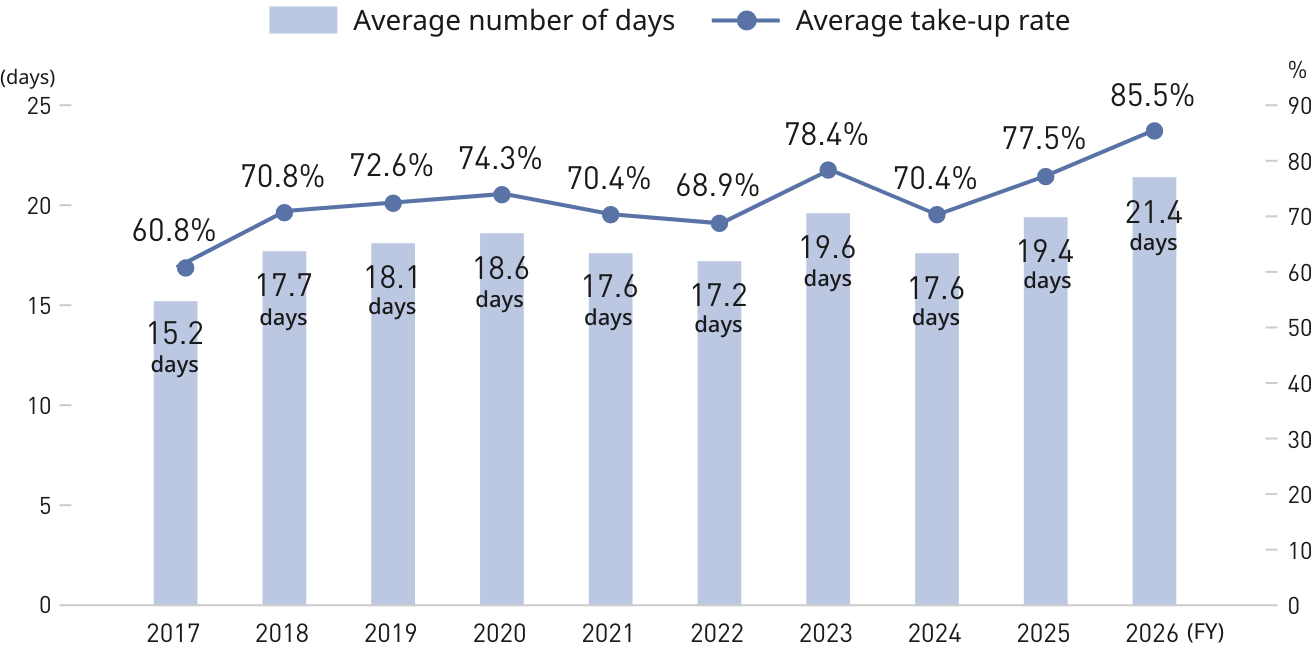
*The figures above are those including employees in managerial positions.
*Number of days of annual paid leave granted: 25 days per year.
2. Develop & Appoint Transformational Leaders
■ Vision :
High-quality decision-making by diverse transformational leaders
■ Critical Indicator :
Diversity rate of the management team* (Excluding the US region)
*Diversity in Executive Officers of Panasonic Holdings Corporation (female employees, employees who are non-Japanese citizens, and mid-career hires)
Target :
More than half (April 2031)
More than half (April 2028)
Currently :
55 % (As of April 1st, 2026)
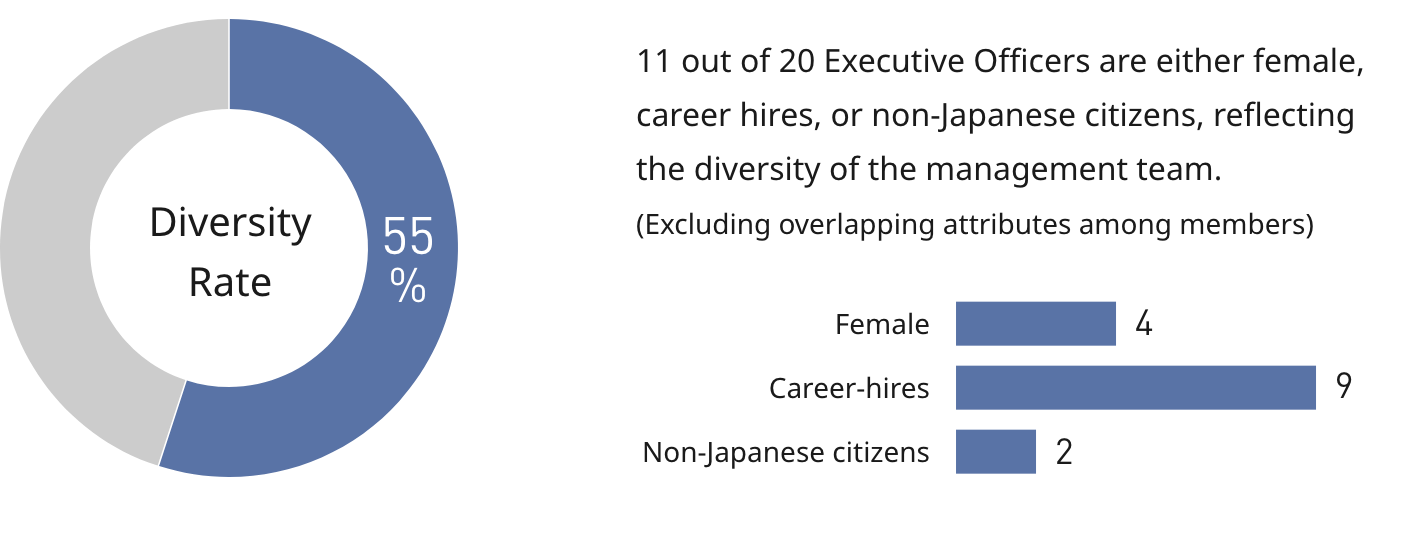
- To learn more about why we emphasize the diversity rate of the management team, please refer to “Develop & Appoint Transformational Leaders.”
■ Relevant Data :
Status of Succession Readiness
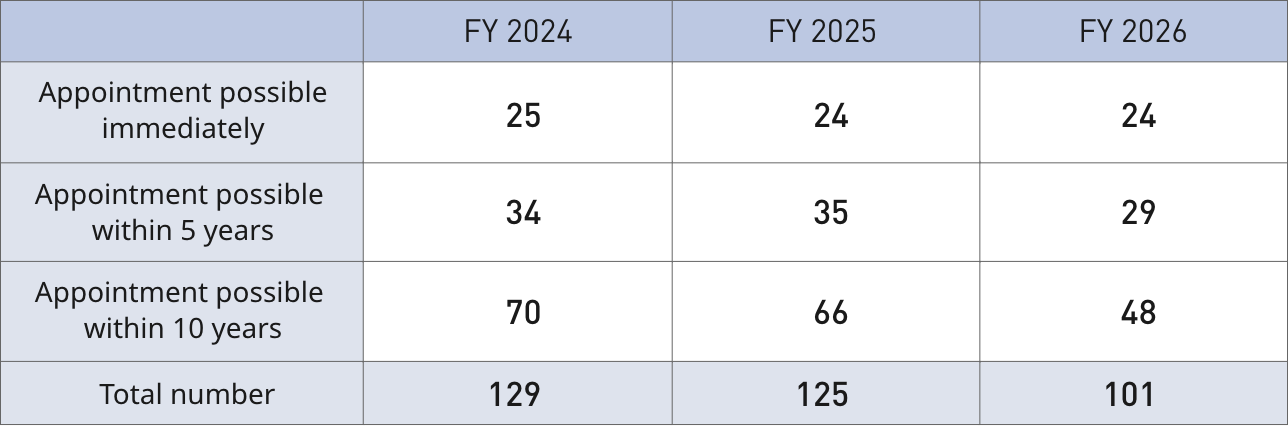
- The number of successors refers to human resources who can be appointed immediately or within 5 to 10 years, selected from among the candidates for Executive Officers of Panasonic Holdings Corporation and Presidents of operating companies or division companies.
- For details on the successor nurturing process, please refer to “Develop & Appoint Transformational Leaders.”
3. Organization Culture Transformation
■ Vision :
Toward a state where every employee can boldly and positively take on challenges by maximizing their skills and abilities
■ Critical Indicator :
UNLOCK Indicator (For both Japan and global regions)
Target :
70 % FY 2032
60 % FY 2029
Currently :
43 % (FY 2026, On a consolidated global basis)
- The UNLOCK indicator is the percentage of favorable responses to both of the following questions in the Employee Opinion Survey: “Enough encouragement is provided by the company or supervisors,” and “There are no significant barriers to taking on challenges.”The UNLOCK indicator is the percentage of favorable responses to both of the following questions in the Employee Opinion Survey: “Enough encouragement is provided by the company or supervisors,” and “No significant barriers to take on challenges.”
- To learn more about the UNLOCK indicators and the rationale for establishing them, please refer to “Panasonic Group’s Human Capital Management in 3 Minutes.”
■ Relevant Data :
Internal open recruitment (Japan region)
As opportunities to proactively shape careers and take on new challenges continue to expand, employee participation in Internal Open Recruitment programs has been increasing across the Panasonic Group. Over the four-year period from FY 2023 to FY 2026, a total of 12,917 employees, exceeding 10,000, applied for internal positions, resulting in 5,236 transfers.
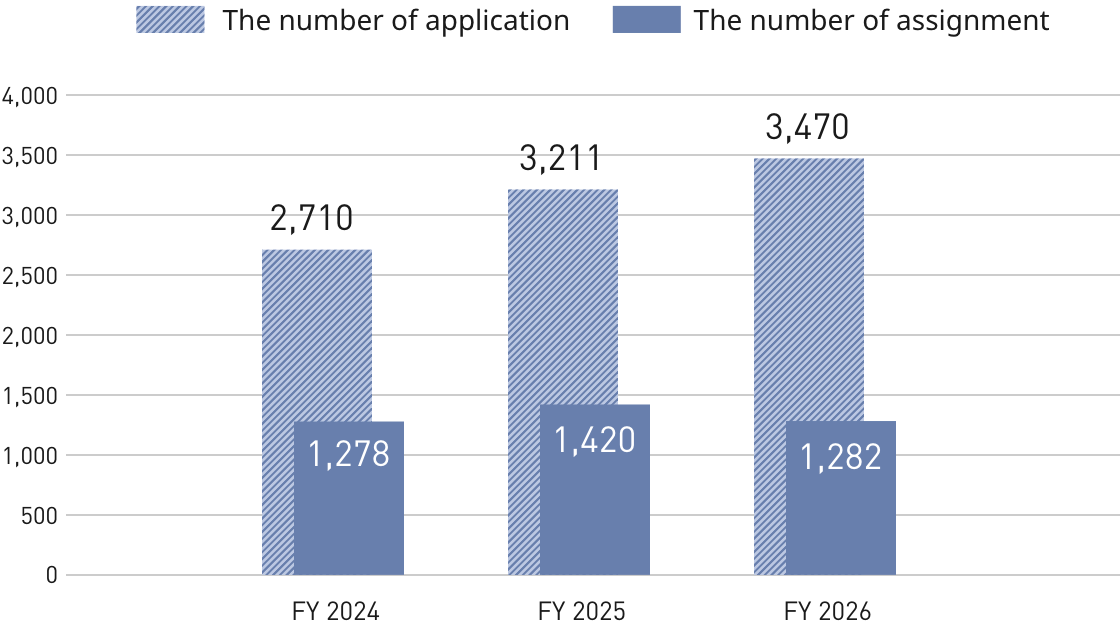
- This figure includes the combined total of the Group-wide Internal Open Recruitment programs (e-Challenge and e-Appeal Challenge) and company-specific internal job posting programs. In addition, e-Matching, an internal mobility platform, was added to the internal job posting programs in April 2026.
- Open recruitment systems specific to each operating company have been introduced at Panasonic Industry Co., Ltd., Panasonic Connect Co., Ltd., and Panasonic Housing Solutions Co., Ltd. When applicants meet the requirements, they can apply for positions of responsibility, such as general manager, manager, or other higher-level roles.
- To support employees in taking on new challenges in their work, the Panasonic Group offers shared programs such as Side Job for external work, as well as Multiple Internal Roles. The latter allows employees to contribute to other departments while continuing their current roles.
Development of Human Resources Capable of Using Data Technology
Through practical applications in the workplace and initiatives that support AI utilization, efforts to promote the effective use of AI are accelerating.

On-Site PX Contest
The number of Applications : 272
The number of Winners : 408
The figures in FY 2026

Cases Supported by PX Ambassadors
The number of Ambassadors : 62
The number of cases supported by Ambassadors : 386
The figures in FY 2026
- For details of the PX Ambassador system, and PX contests at each site, please visit “Signs of Change in Panasonic Group.”
- For details of the Panasonic Transformation (PX), please visit DX Transformation.
4. Promotion of DEI (initiative in the Japan region)
■ Vision :
Toward participative management by enabling each employee to leverage their unique strengths, regardless of background or personal attributes
■ Critical Indicator :
Ratio of Female Managers* (Japan region)
Target :
16 % or greater (April 2031)
12 % or greater (April 2028)
Currently :
8.3 % (As of April 1,2026)
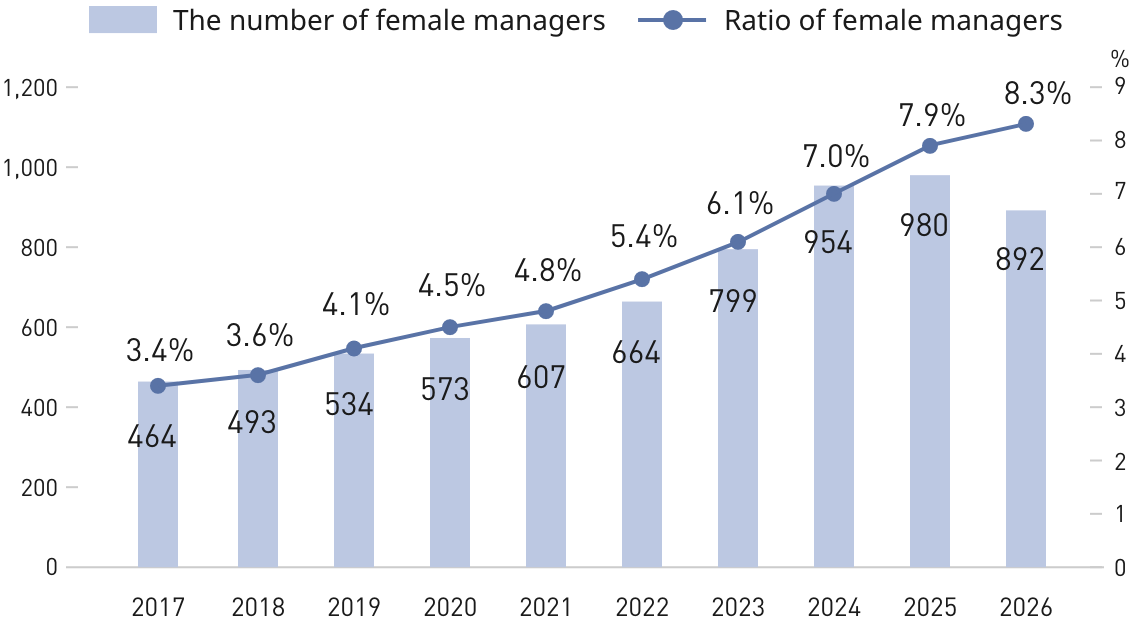
*The figures above refer to employees with no fixed-term employment.
- For our ideas and initiatives on gender equity, please refer to “Support for Every Individual: Gender Equity.”
■Relevant Data :
Managerial positions (Japan region)
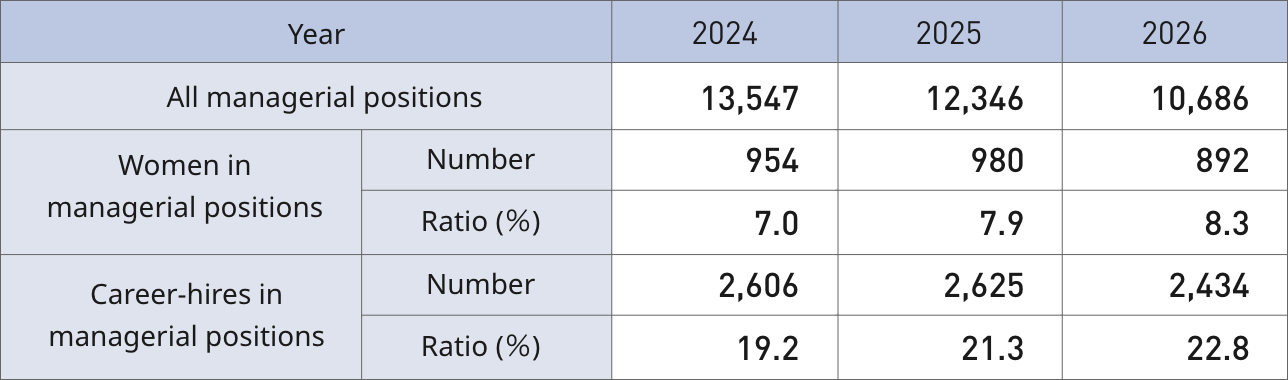
As of April 1 in each year
- The presence and impact of mid-career hires continues to grow across the Group. Recognizing this as a leading indicator, we will further accelerate initiatives to increase the proportion of female managers.
Gender gap in compensation* (Japan region)
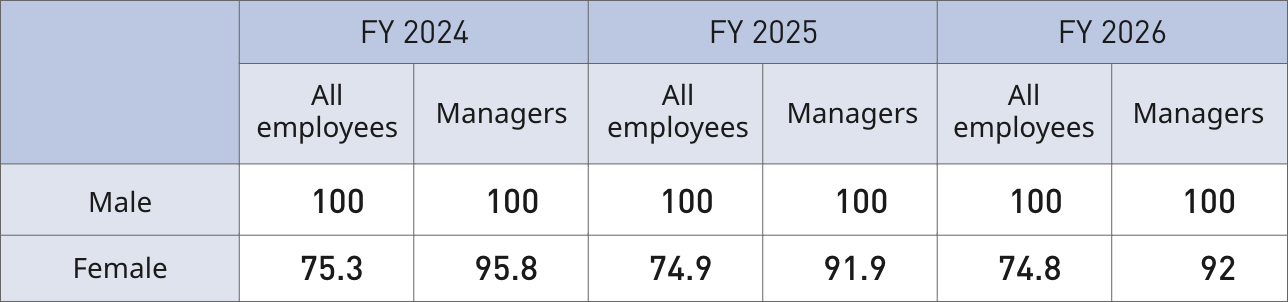
*Calculated based on salaries and bonuses.
- The compensation system does not include any disparities based on gender, gender identity, or other personal attributes. The gender gap in compensation is not believed to result from the compensation structure or system itself, but rather from factors such as differences in the grade system. Accordingly, we will strive to promote diversity that is not defined by characteristics such as gender.
- For details on our ideas and initiatives for gender equity, please refer to “Support for Every Individual: Gender Equity.”
Childcare leave (Japan region)
The rate of childcare leave taken by men increased from 34% in FY 2016 to 89% in FY 2026, representing a 55-percentage-point improvement over the past decade. The continued expansion of men’s participation in childcare is expected to contribute to further progress toward gender equity in the years ahead.
Men’s days/rate* taken
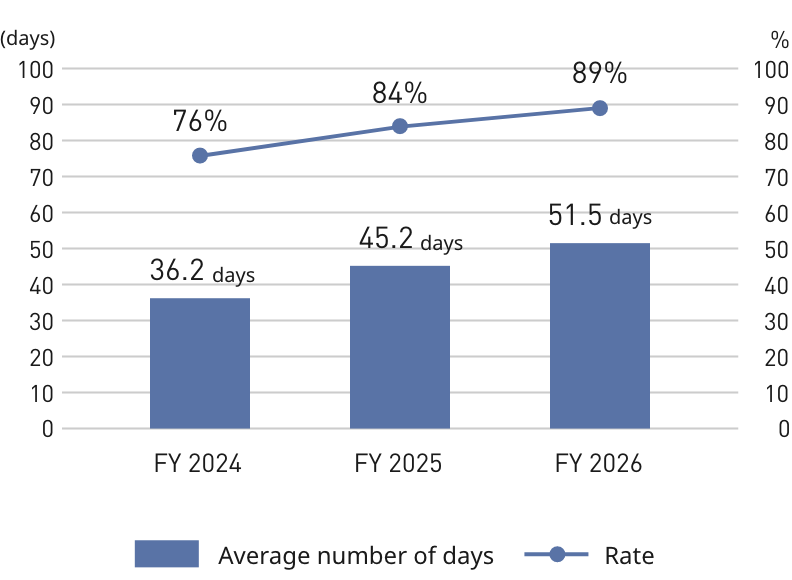
Women’s days/rate* taken
*The percentage is calculated by dividing the total number of employees who took childcare leave or used leave systems for caring for preschool children during the relevant fiscal year by the number of employees who, or whose spouses, gave birth in the same fiscal year (employees with no fixed-term employment).
*The percentage can exceed 100% if a parent starts taking childcare leave in the relevant fiscal year for a child born in the previous fiscal year.
- Various systems are in place to help employees balance career development with life events such as childbirth and childcare.
- We are working to raise awareness within the company so that employees can use these systems when necessary.
- For details, please visit “Support for Every Individual: Diverse Work Styles and Work-Life Balance” and “Examples of Diverse Work Styles.”
Employment of people with disabilities (Japan region)
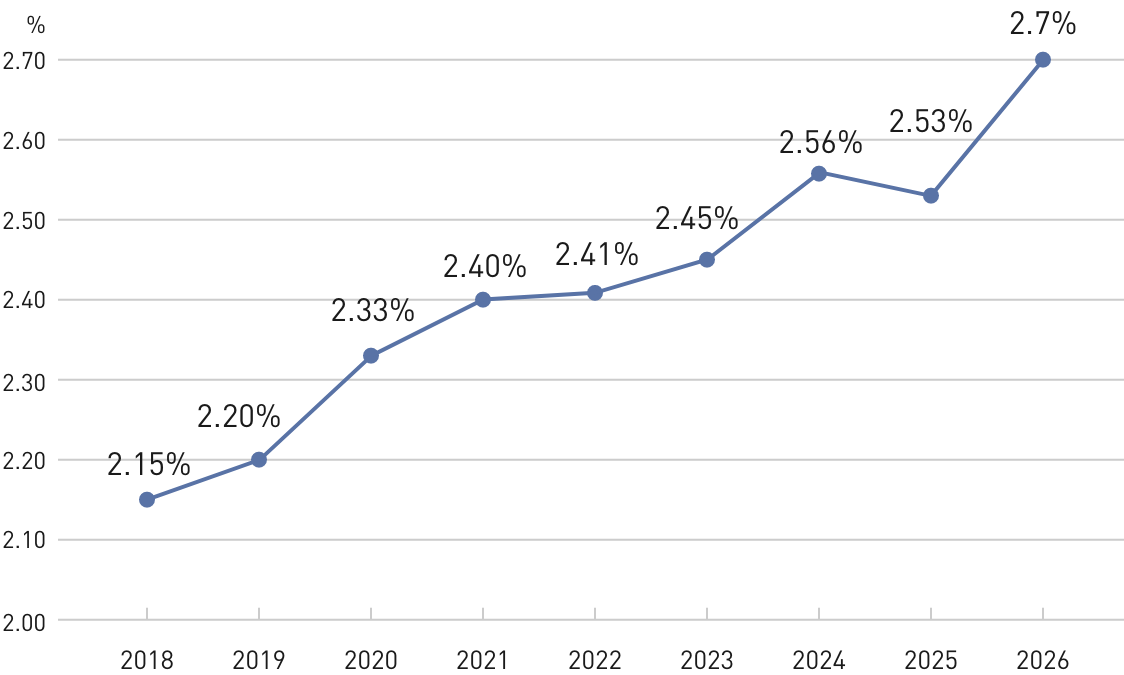
As of June 1 in each year
- We have achieved an employment rate that exceeds the legally required employment rate of people with disabilities.
- We continue to promote the creation of workplaces where every employee, regardless of physical or mental condition, can take on challenges and play an active role. For details, please refer to “Support for Every Individual: People with Disabilities.”
5. Transformation in HR Function
(Utilization of AI)
■ Vision :
Enhancing the employee experience through highly productive HR management utilizing AI
■ Relevant Data :
Utilization of One-Stop HR Service Customized for Employees (Japan region)

Users :
23,879 users/month (FY 2026)
The number of utilizations :
62,050 times/month (FY 2026)
- The figures above are calculated based on the number of log-in IDs and log-ins to “My Pages” of the service site.
- For details on the One-Stop HR Service, please refer to “Transformation in HR Function (Utilization of AI).”
Adoption of the Employee AI Career Support Tool (Japan region)

Users :
1,645 users (FY 2026)
The number of utilizations :
2,632 times (FY 2026)
- Users refer to unique users.
- To learn more about the Employee AI Career Support Tool, please refer to “Transformation in HR Function (Utilization of AI).”
Utilization of AI Career Supporter for Job Seekers (Japan region)

Users :
3,392 total number of people
The number of utilizations :
5,177 total number of times
- The figures above represent the total from May 2025 through March 2026.
- AI Career Supporter is an AI-powered information tool designed to support students’ early career choices. For details, please refer to “Transformation in HR Function (Utilization of AI).”
Productivity in HR Function (Japan region)

The number of employees managed by 1 FTE* HR employee in the Japan region
Target :
63 (FY 2031)
Currently :
44 (FY 2026)
*Full-Time Equivalent (FTE) is a measure of workload expressed as the equivalent number of full-time employees.

The ratio of HR employees in charge of special tasks or those related to strategies*
Target :
65 % (The level of leading global companies)
Currently :
52 % (FY 2026)
*Among all the tasks of HR employees, the ratio of those related to HR strategy, and the development of talents/organization.
- For details on productivity enhancements in the HR function, please refer to “Transformation in HR Function (Utilization of AI).”
More Information on Our Transformative Actions


