
Overview of Environmental Impact and Environmental Accounting
Overview of Environmental Impact from Business Operation
In order to mainly manufacture and market electrical and electronic products, Panasonic Group consumes petroleum and electricity as energy sources and resources as raw materials of parts and components. As a result, we emit CO2 and wastes into the environment.
Overview of Environmental Impact from Business Operation
Overview of Environmental Impact from Business Operation
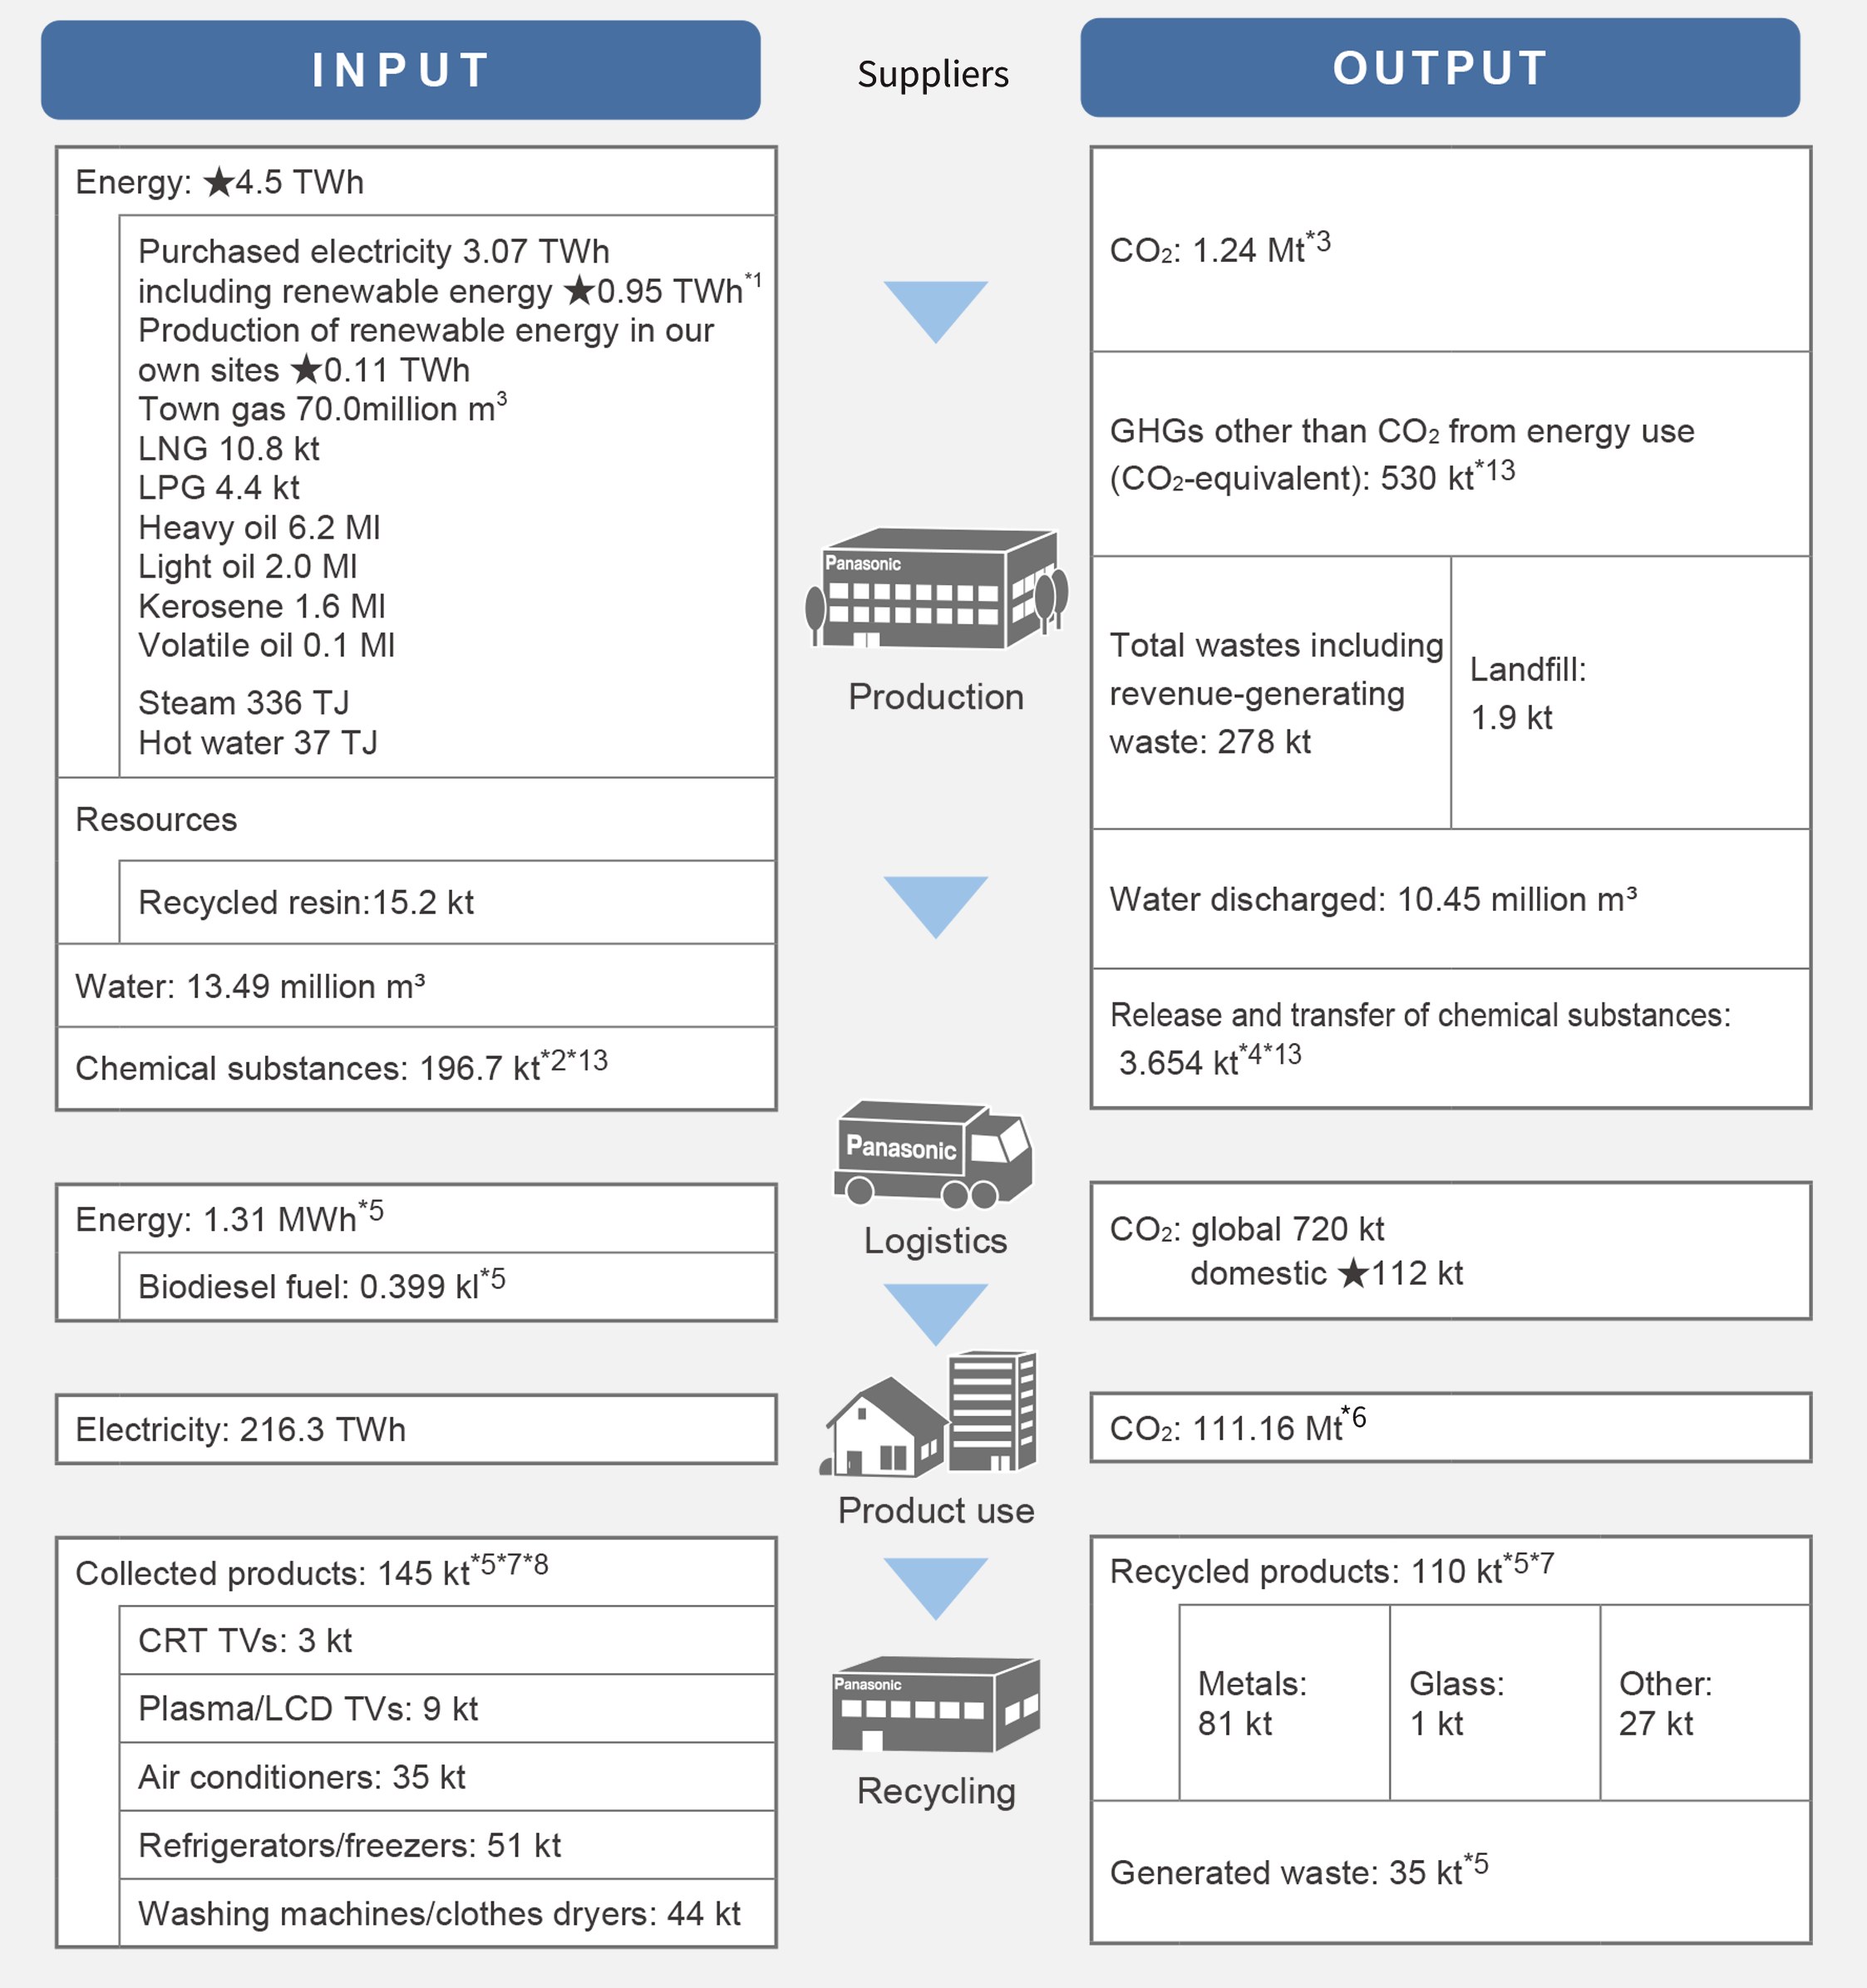
Production: 218 manufacturing sites and 74 non-manufacturing sites
Logistics: Logistics stage of procurement, production, marketing and waste by partner companies and Panasonic.
Product use: Lifetime power consumption (a) of major products*9 with large amounts of energy use and CO2 emissions (b) associated therewith.
a = Annual power consumption of a model sold*10 x Sales quantity x product life*11
b = Annual power consumption of a model sold*10 x Sales quantity x product life*11 x CO2 emission factor*12
Recycling: Recycling of products means to use by oneself or to make into a state available for sale or free of charge the components and materials of a separated product.
*1 Included renewable energy by deemed certifications such as non-fossil certificates.
*2 Target substances include all substances in the Panasonic Group Chemical Substances Management Rank Guidelines (For Factories).
*3 The factors related to fuels are based on "the Guidelines for Calculation of Greenhouse Gas Emissions (version 4.7)" published by the Japanese Ministry of the Environment.
The latest figures from the "IEA Emissions Factors 2024" issued by the International Energy Agency (IEA) is used for the CO2 emission factors for electricity purchased from different countries use. The factors for domestically purchased electricity in Japan for fiscal 2025 stated in the "Guidelines for Calculation of Greenhouse Gas Emissions" published by Japan's Ministry of the Environment.
*4 Release amount: Includes emissions to air, public water areas, and soil.
Transfer amount: Includes transfer as waste and discharge into the sewage system. Recycling that is free of charge or recycling where we pay a fee for treatment under the Waste Management and Public Cleaning Law is included in "Transfer." (Different from the transferred amount reported under the PRTR Law.)
*5 Intra-region outside Japan not included.
*6 Included refrigerant leakage in sold product use.
*7 Air conditioners, TVs, refrigerators/freezers, and washing machines/clothes dryers
*8 As for personal computers, PC 3R Promotion Association collects and recycles PCs under the joint scheme with member companies.
*9 Lighting equipment and lamps, Household air conditioners, commercial air conditioners, household refrigerators, washing and drying machines, ventilation fans, bathroom ventilation dryers, electric water heaters, electric fans, A2W (Hot-Water and Heating Systems with Heat Pump), EcoCute, electronic rice cookers, dish washer and dryers, LCD TVs, Organic EL TVs, microwave ovens, heat exchange systems, blowers, chip mounters, commercial display Cases, hair dryers, IH cooking heaters, dehumidifiers, range hoods, vacuum cleaners, irons, electric thermos pots, projectors, digital Signage, welding machine, welding robot, insertion equipment, printing equipment, Mobile Computer, electric bidet toilet seats, freezers, commercial refrigerators and freezers, absorption freezers, well water pumps, telephones, air purifiers, faxes, humidifiers, digital cameras, headphones, electrically-assisted bicycle, motors for air conditioning, motors for refrigerator, motors for FA application, etc.
*10 For each product category, the model that was sold in the largest quantity in the region was selected.
*11 Number of years during which spare parts for the product are available (defined by the Panasonic Group).
*12 Regional CO2 emission factors (kg-CO2/kWh) used: 0.464 (Japan); 0.280 (Europe); 0.355 (North America); 0.589 (China & Northeast Asia); 0.732 (India & South Asia); 0.379 (Southeast Asia & Oceania); 0.222 (Latin America); and 0.379 (Middle East & Africa).
*13 Hussmann Parent Inc. and its consolidated subsidiaries not included.
GHGs from the Whole Supply Chain (by Scope)
We calculate our GHG emissions across the supply chain for Scopes 1, 2, and 3, respectively, according to the GHG Protocol and the guidelines provided by the Ministry of the Environment.
In fiscal 2025, the entire emissions for Scopes 1 to 3 totaled 145.62 million tons. The largest source of emissions per category was from Category 11 under Scope 3, which accounted for 76% of the entire emissions.
Compared with fiscal 2024, fiscal 2025 saw an increase in emissions of 19.1 million tons. The major cause was the proactive expansion of businesses covered under Category 11, causing that category's emissions to increase by 20.13 million tons. Also, facility investment anticipating business growth increased the Category 2 emissions by 480,000 tons. On the other hand, we reduced Scopes 1 and 2 emissions by 150,000 tons, thanks to steady efforts in implementing various energy-saving schemes and further introduction of renewable energy.
We continue to disclose our emission data for transparency.
*14 Direct emissions from facilities owned and controlled by the Panasonic Group (e.g., emissions from use of town gas or heavy fuel oil).
*15 Emissions from production of energy consumed at facilities owned and controlled by the Panasonic Group.
*16 Other indirect emissions, excluding Scope 1 and Scope 2.
*17 8.84 (Mt) are due to the influence of CFC
*18 6.06 (Mt) are due to the influence of CFC
*19 7.01 (Mt) are due to the influence of CFC
*20 6.18 (Mt) are due to the influence of CFC
Environmental Accounting
Panasonic Group globally collects data on its environmental conservation costs and economic benefits obtained through its environmental activities in relation to generated/controlled environmental impact. This data is internally utilized as basic information for our continuing environmental sustainability management.
Environmental Accounting for Fiscal 2025
*21 Includes all investments relating to environmental conservation. The difference or appropriate portions (divided proportionally) are not calculated.
*22 Expenses include a cost of capital investment depreciation. For example, if latest energy-saving facilities were installed, the value includes depreciation for the first year but not for the second year and later.
*23 The economic benefit represent the cost of energy savings achieved through energy conservation, which translates into cost reductions that contribute to climate change mitigation.
Environmental Conservation Benefits for Fiscal 2025 (in physical terms)
Fiscal 2024 data on the reduced amount of electricity and effect of reduced electricity costs through our energy-saving products are as shown in the chart below.
Economic Effects for Customers for Fiscal 2025
*24 Calculated under the same conditions as when determining the size of contribution in reducing CO2 emissions through energy-saving products
*25 Electricity costs were set for each region based on IEA Statistics.
Panasonic Group published a new vision "Panasonic GREEN IMPACT" in January 2022, with the intention to realize the vision linking with our business activities. Therefore, approximately 477.8 billion yen for the group-wide total R&D expenses in fiscal 2025 will be invested mostly for promoting "Panasonic GREEN IMPACT".