


The Panasonic Group positions contribution to solving issues related to the global environment as one of business materiality.*1 Two issues of particular urgency are climate change and resource exhaustion. Therefore, we believe it is indispensable to build a carbon neutral (CN) society*2 by limiting the temperature rise to 1.5°C by 2050 and shifting to a circular economy (CE),*3 which is a resource-recycling economic system.
To commit to achieve these goals as a responsible company, and to accelerate our contribution to society and to our customers, we announced Panasonic GREEN IMPACT (PGI), our group-wide long-term environmental vision, in January 2022.
PGI is a strategy to address the social issues of climate change alleviation and resource recycling as an opportunity to improve our corporate value by reducing their risks, identifying opportunities to grow businesses and generate income, and strengthen our capital market reputation. PGI is designed to deliver both “better lives” and “a sustainable society” through our business activities. By accumulating each effort (ACT) made by the group, we aim at early resolution of environmental issues, such as climate change and resource exhaustion.
*1 Priority issues to create value for society through business activities (Please refer here).
*2 Achieving net-zero emissions of GHG gases (including CO2) by balancing emissions and absorptions.
*3 An economic system that preserves and maintains the values of products, materials, and resources for as long as possible to minimize waste generation.
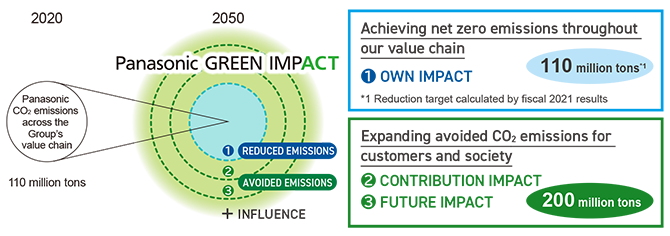
Converting CO2 Reduction Impact into Business Growth, Financial Value, and Corporate Value
【2050 Goal】
By 2050, we aim to create a CO2 reduction impact of 300 million tons or more per year,*4 through exercising our duty and influence throughout the value chain (❶ OWN IMPACT), contributing to society and customers (❷ CONTRIBUTION IMPACT), expanding such contribution (❸ FUTURE IMPACT), and spreading their effect throughout society (INFLUENCE). The results should then be converted to our financial and corporate values.
*4 300 million tons is equivalent to approximately 1% of global CO2 emissions (31.7 billion tons) in 2020.
❶ OWN IMPACT: Reduced CO2 emissions compared with CO2 emissions from the entire value chain (VC) in 2020.
We aim to achieve net zero CO2 emissions within our own value chain*5, along with the effect of the broader decarbonization of society*6 OWN IMPACT shows the "impact from CO2 emissions reduction" by comparing the difference between the CO2 emissions of the current year and those in 2020.
*5 Total of CO2 emissions from our business activities (Scopes 1 to 3) including emissions from our operating companies (Scopes 1 and 2), emissions from manufacturing components and materials (Scope 3, Category 1), and emissions in product use (Scope 3, Category 11) (Please refer here)
*6 Improvement in CO2 emissions factor for electricity by respective electric power suppliers.
❷ CONTRIBUTION IMPACT: Avoided CO2 emissions in present business fields*7
We aim to achieve avoided CO2 emissions of at least 100 million tons per year among customers and society through our present business fields.
❸ FUTURE IMPACT: Avoided CO2 emissions by creating new technologies and businesses*7
We aim to achieve avoided CO2 emissions of at least 100 million tons per year among customers and society by creating new technologies and businesses.
*7 Amount of our contribution as CO2 emissions reduction to society and customers through using our products and services (Please refer here).
+ INFLUENCE: Positive ripple effect of energy reform and decarbonization of society
We provide a positive influence on society by changing the behavior (ACT) of a wider range of people through the Panasonic Group's products, services, and social communications.
(Initiatives to raise awareness of and enhance the recognition of avoided emissions, free publication of patents, corporate citizenship activities, environmental education, etc.)
Creation and Expansion of Economically Rational CE Business
In 2023, we announced the CE Group Policy in order to set out the maintenance and improvement of the value generated by resources as the foundation of our business operations.
Based on this policy, we will identify the issues in shifting to CE-oriented business according to the characteristics of individual businesses. By working around such issues we can further the creation and implementation of our business strategies and action plans.
❹ Maximize the product lifetime and maintain the material value with a focus on circular business models and product design, extended servicing, as well as through further enhancing recycling activities.
❺ Minimize the use of materials and extend the usage of recycled and renewable materials.
❻ Make a joint approach with customers and partners for establishing circularity-oriented business operations, information sharing, and product usage options.
Environmental Action Plan GREEN IMPACT PLAN
Status of GREEN IMPACT PLAN (GIP) 2024+1
To contribute to resolving global environmental issues (Panasonic GREEN IMPACT), the Panasonic Group established and is driving forward its environmental action plan, setting out Environmental KPIs—clear targets to address priority issues.
Our environmental action plan commenced as Green Plan 2010 announced in 2001, and evolved into Green Plan 2018 announced in 2010, then to Green Plan 2021 in 2018. These plans were formulated focusing on climate change alleviation and resource recycling to integrate environmental consideration with business management. The plan has been adapted according to changes in medium- to long-term management policies and business portfolios, taking account of the relationships between social issues and our respective businesses. Social movements, such as the Paris Agreement in 2015, have also been reflected in the plan.
Along with the announcement of PGI in 2022, we also formulated GREEN IMPACT PLAN (GIP) 2024, which is linked to the medium- to long-term business strategy to reinforce our environmental engagement. In fiscal 2026, we commenced GIP 2024+1, a single year target that was extended from GIP 2024, to prepare for the group-wide growth strategy to begin in fiscal 2027, along with structural reform of the group management. With GIP 2024+1, we achieved the OWN IMPACT targets thanks to the steady increase in net zero factories*8 toward the 2030 targets in the CO2/Energy area, as well as the accelerated spread of LED lighting and expanded usage of natural refrigerants in ventilation and aircon equipment were also contributors to reducing emissions from customers using our products.
From an overall perspective, we also achieved the CONTRIBUTION IMPACT targets. However, efforts in the Resource/Circular Economy (CE) area are still working toward their targets in each business.
*8 Sites that have achieved our definition of "net zero" when energy-derived CO2 emissions from our business activities (at factories and offices) are combined with energy saving, renewable energy use, purchase of renewable energy electricity certificates and carbon credits.
GREEN IMPACT PLAN 2024+1 (FY2026 Targets, Results, and Evaluation Points)
Note: This article refers to Priority Issues only.
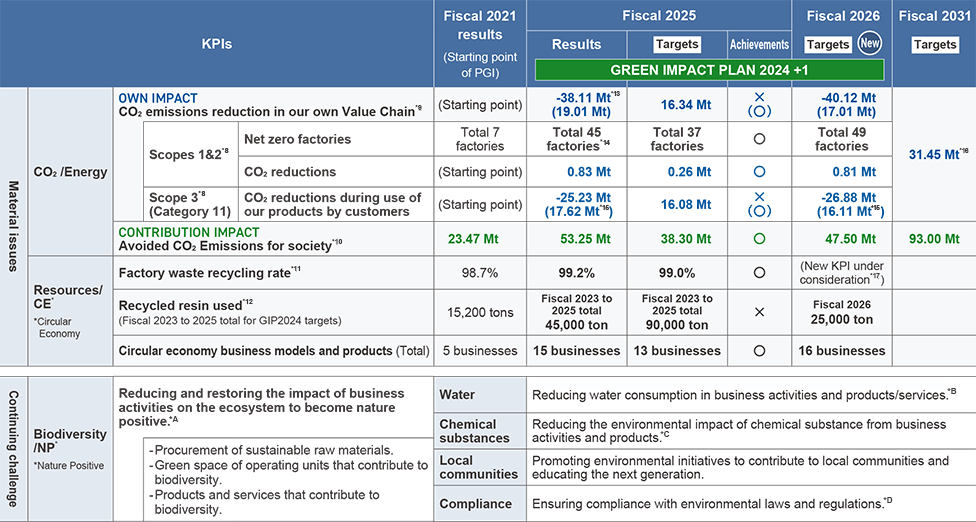
*9 Amount obtained by subtracting the amount of emissions in the relevant fiscal year from the amount of emissions in fiscal 2021.
*10 Classification according to the GHG Protocol (Accounting and Reporting Principles).
*11 Amount calculated by subtracting the lifetime CO2 emissions after introduction from the lifetime CO2 emissions assuming that the Group's products and services do not exist (Please refer here).
*12 Mass of recycled materials contained in the recycled resin used in our products.
*13 Minus sign (-) means increasing emissions. Including increases or decreases in Scope 1,2 and Scope 3 Category 11, Category 1 (procurement), Category 12 (disposal), and other indirect emissions.
*14 Based on the Implementation Rules for the Management of Renewable Energy Green Electricity Certificates (Trial) enforced in November 2025. It includes the revision of the Green Electricity Certificates rules in China.
*15 The figures is a comparison with fiscal 2021 results (starting point) reflecting the equivalent amount of emissions from the products whose calculations became available after 2021.
GIP 2028 and FY2031 targets
GIP 2028 sets out the Group targets to achieve by fiscal 2029 (including the renewed fiscal 2031 target for CO2 reduction impact). GIP 2028 is linked with the new business growth strategy established after the Group management reforms that took place in fiscal 2026, covering new and expanded indices that can be corporate value drivers. The following are the main renewal points:
- OWN IMPACT in fiscal 2031 will be estimated to be 5.5 million tons despite the fiscal 2026 result being 27.45 million tons. This figure took account of two factors: firstly, the CO2 emissions increase due to the spread of air conditioners and ventilators while reducing their emissions by improving energy-saving performance and lowering the GWP*16 of refrigerants; and, secondly, practical estimation of the slowing speed of improvement in electricity-related CO2 emission factors in different regions across the world.
- To achieve net zero CO2 emissions in all designated sites by fiscal 2031, we upgraded the former CO2 reduction criteria to "net CO2 reductions," which utilize energy-saving schemes, renewable energy usage (self-power generation and PPA*17), and purchase of renewable energy certificates.
- Avoided emissions for our customers and society*18 (CONTRIBUTION IMPACT) was set at 77 million tons to be achieved by fiscal 2031, based on the 48.46 million tons recorded in the fiscal 2026 results. These results will be mainly led by the achievements in the Device area; at the same time the portfolio making up the contribution areas set in the original PGI has changed.
- A new index was added to the CE area to expand recycled material applications. In addition to recycled resin, recycled steel (electric furnace steel) was added as a new index. We also plan to generate two new CE business models or products.
*16 Global Warming Potential: an indicator of the size of the global warming effect from a gas.
*17 Power Purchase Agreement: a purchase contract of renewable energy-sourced electricity.
*18 Amount calculated by subtracting the lifetime CO2 emissions using the Group's products and services from the lifetime CO2 emissions of not introducing the Group's products and services (Please refer here).
GREEN IMPACT PLAN 2028 (FY2029 Targets) and CO2 Reduction Impact FY2031 Targets

*19 Panasonic GREEN IMPACT (Please refer here).
*20 To ensure the Group's reduction efforts, the baseline FY2021 emissions were recalculated using products covered by the FY2027 plan.
*21 Sites that have achieved our definition of "net zero" when energy-derived CO2 emissions from our business activities (at factories and offices) are combined with energy saving, renewable energy use, purchase of renewable energy electricity certificates and carbon credits.
*22 CO2 emissions reduced by energy-saving schemes, renewable energy generation, and purchasing renewable energy certificates.
*23 297 sites as of March 2026.
*24 The mass of recycled materials contained in the recycled resin used in the Group's products. The amount is calculated based on the information available to us, as some manufacturers have restrictions on disclosing their production information.
*25 The mass of electric furnace steel used in the Group's products.
*26 Among the CE businesses under our definition, the number of businesses that started a new service or product that offers novel recycling value.
The Status of Progress in CO2-related Indices to Fiscal 2026 and Breakdown of GIP 2028 and 2030 Targets

❶[CO2 Emissions by Scope]
❷[Environmental Preservation
and Economic Effects of Sites]
❸[Environmental and Economic Effects for Customers]
*27 Dotted area is estimated emissions due to the widening of responsible areas in line with the introduction of stricter laws and regulations and refinement of calculation since 2022, when PGI was established. Extended coverage of disclosure by laws and regulations (motors and refrigerants in use/ disposal), refinement of calculation (26 products such as freezers), business portfolio changes (Hussmann Corporation, etc.) and new business growth (A2W, etc.)
*28 Sites that have achieved our definition of "net zero" when energy-derived CO2 emissions from our business activities (at factories and offices) are combined with energy saving, renewable energy use, purchase of renewable energy electricity certificates and carbon credits.
*29 CO2 emissions reduced as a result of energy savings, renewable energy use and renewable energy electricity certificates.
❶[CO2 Emissions by Scope] For details, refer to Environmental Data
(Unit : 10kt)
| Scope 1,2 Subtotal | ||||||||
| Scope 1: Direct emissions from facilities owned and controlled by the Panasonic Group | ||||||||
| Scope 2: Emissions from production of energy consumed at facilities owned and controlled by the Panasonic Group. | ||||||||
| Scope 3: *The numbers 1–15 at the beginning are category numbers. Categories 8, 13, and 14 are not covered. | ||||||||
| Procurement | Other Scope 3 Categories | |||||||
| 1 | Purchased goods and services | 1,901 | 2 | Capital goods | ||||
| 3 | Fuel- and energy-related activities | |||||||
| Products and services | 4 | Upstream transportation and distribution | ||||||
| 11 | Use of sold products | 10,890 | 5 | Waste generated in operations | ||||
| 6 | Business travel | |||||||
| Energyderived | 10,301 | 7 | Employee commuting | |||||
| 9 | Downstream transportation and distribution | |||||||
| 10 | Processing of sold products | |||||||
| Refrigerant leakage | 590 | 12 | End-of-life treatment of sold products (Refrigerant: 515, Others: 178) | |||||
| 15 | Investments | |||||||
We collect data on how our environmental impact (and controlled emissions) affects investments/expenditures and economic benefits.
This data is utilized internally as basic information for our continuing environmental sustainability management.
❷[Environmental Preservation and Economic Effects of Sites]
| Emission reduction | Investments and expenses | ||
| Reference indicator: environmental impact | |||
| FY2025 | FY2026 | ||
| 130 kt | 1.24 Mt*30 | 1.11 Mt*30 | Investments*31 Expenses*32 |
| ▲101 k count | 339 k count | 440 k count | |
| ▲0.1 kt | 1.9 kt | 2.0 kt | |
| 40,000 m3 | 13.49 Mm3 | 13.45 Mm3 | |
*30 Energy-based CO2 emissions under Scope 1 + Scope 2 - carbon credit amount (differs from subtotal of Scopes 1 and 2)
*31 Includes all investments relating to environmental conservation. The difference or appropriate portions (divided proportionally) are not calculated.
*32 Expenses include a cost of capital investment depreciation. For example, if latest energy-saving facilities were installed, the value includes depreciation for the first year but not for the second year and later.
*33 The economic benefit represents the cost of energy savings achieved through energy conservation, which translates into cost reductions that contribute to climate change mitigation.
❸[Environmental and Economic Effects for Customers]
*34 Calculated under the same conditions as CONTRIBUTION IMPACT (Avoided CO2 emissions); however, contribution of electrification was excluded.
*35 Electricity costs were set for each region based on our investigation.
Simultaneous increase in avoided CO2 emissions and business opportunities in growth areas, converted to financial and corporate values
Avoided CO2 emissions ("avoided emissions") is a leading indicator of growth calculated by converting the volume of electricity and fuel consumption that is made efficient by the introduction of new technologies and products and services ("products") to show quantitatively the reduction in CO2 emissions provided to customers and society. Internationally, the term "avoided emissions" represents an approach to determine the volume of emissions that would have been released if the product had not introduced, thus defining the product's positive impact on climate change. The increase in avoided emissions from our existing businesses (CONTRIBUTION IMPACT) and from new technologies expected to generate new business (FUTURE IMPACT) signify a rise in our competitiveness and business opportunities in growth markets.
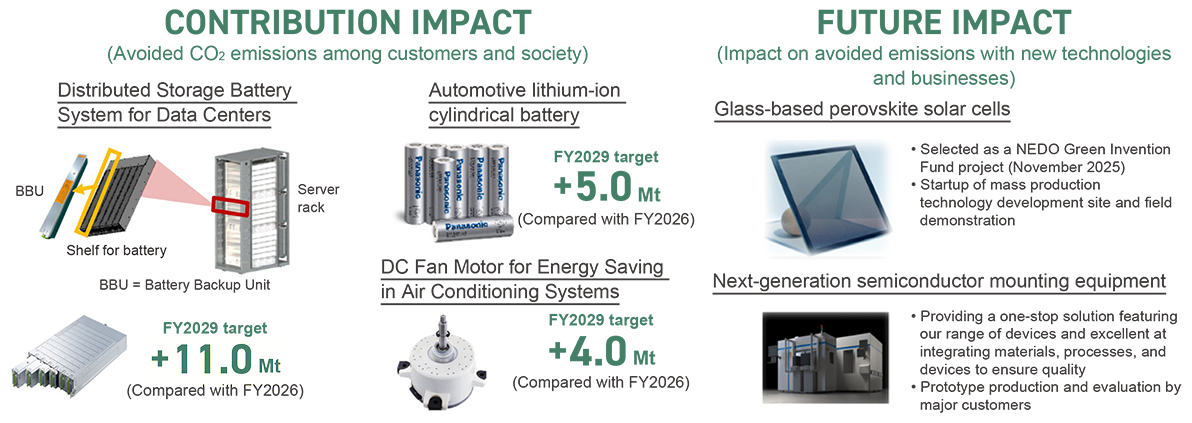
In CONTRIBUTION IMPACT, our contribution to CO2 reduction is being propelled in our Devices business by products such as lithium-ion batteries (used in electric vehicles*36, storage battery systems for data centers*37, etc.) and DC motors*38 (used in air conditioning systems, etc.), increasing from 48.46 million tons in fiscal 2026 to 71 million tons in fiscal 2029 and further to 77 million tons in fiscal 2031.
In FUTURE IMPACT, expected to accelerate the rise in avoided emission in the future (impact of new technologies and businesses that emerged after announcement of PGI in 2022), we are making advances in renewable energy use in urban areas by the use of building-integrated Perovskite photovoltaics glass. In next-generation semiconductor mounting equipment, we are involved in the development and future implementation of technology that achieves both advanced semiconductor performance and energy-saving with the 3D stacking process.
In avoided emissions, we refer to two main international standards (WBCSD Guidance on Avoided Emissions*39 and IEC 63372, the international standard governing the quantification and communication of avoided emission, published by IEC*40). By creating a reference scenario and baseline products (products subject to comparison) based on "hypothetical" emissions that are most likely if the product is not launched, the difference in the volume of emissions through the product's entire life cycle or before and after connection of the product is multiplied by its valid period and annual sales volume. Next, these baseline products and the various factors employed in calculation are reexamined and updated in business planning each year.
Our products and services were classified into the following four, based on the reduction mechanism.
- Electrification: Electrified appliances and components that use energy more efficiently than those that use fossil fuels.
- Replacements (Better energy-saving performance): Products with same functional performance but better energy-saving.
- Solutions: Products that optimize power consumption throughout entire building spaces and facilities.
- Others: Various contributions other than above, such as clean power generation, building insulation., etc.
Typical examples of how CONTRIBUTION IMPACT is generated are shown on the next and subsequent pages. Examples of various products and services that contribute to CO2 reduction at our customers and in society are also shown on the following website.
[Supplement] We conduct the following measures in time with the disclosure of avoided emissions in this Report.
・Disclosure assumes that steady advances are being made in value chain emissions (Scope 1, Scope 2 and Scope 3) to fulfill our mission to achieve SBT's net zero standard (Please refer here)
・We examine the "rebound effect" which is found in each product after product dissemination. To date, we have not found any significant rebound other than an increase in life cycle emissions.
・To enhance the objectivity of the disclosed information, independent third-party assurance has been obtained for the avoided emissions calculated using the methodologies and supporting data described in this Report.
The CO2 reduction impact has already been actualized*41 as financial value. To ensure that avoided emissions win the appropriate evaluation in the capital markets as a new value indicator linked to financial value, we have standardized it as an indicator that enables international and inter-company comparisons, together with the creation/growth of the impact, for integrated action to achieve social implementation by companies and connection/coordination with financial and capital markets.
Additionally, we are encouraging a behavioral change in our stakeholders and the conversion of social value into financial and corporate values.
*36 In the case of the electric vehicle, chiefly the difference between electricity and fuel-derived CO2 emissions through the entire life cycle when compared with an internal combustion engine vehicle
*37 In the case of storage battery systems for data centers, the difference in CO2-equivalent volume through the entire life cycle of electric power supplied to IT equipment when compared with a conventional centralized power source
*38 For DC (direct current) motors, the difference in CO2-equivalent volume of electricity consumption through the entire life cycle when compared with conventional AC (alternate current) motors
*39 World Business Council for Sustainable Development
*40 International Electrotechnical Commission
*41 An example is the tax deduction of $35/kWh we receive for the volume of mobile batteries we manufacture in North America under the US Inflation Reduction Act (IRA).
CONTRIBUTION IMPACT Results and Plans Unit: Mt / Figures in parentheses indicate the number of products

*The results for fiscal year 2026 include five products from the current Panasonic Housing Solutions Co., Ltd.
 Solution Field
Hot-Water and Heating Systems with Heat Pump (EcoCute, A2W*42)
*42 A2W (Air to Water) : Air-to-water Heat Pumps for Europe
Main product life stages subject to avoided CO2 emissions

Sales regions: Japan for EcoCute, and Europe for A2W
■Product overview:
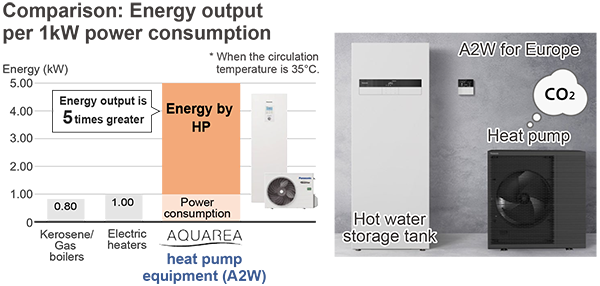
A heat pump (HP) hot-water and heating system supplies hot water and heats rooms. The system extracts ambient heat from the air by an electric fan and transfers it into a natural refrigerant (CO2). Next, it compresses the refrigerant in an electric compressor to heat it, and the refrigerant's heat is exchanged with the water. The heated water can then be used for hot water and for room heating. To obtain the same amount of heat, electric HPs have 2.4 to 4.3 times*43 better energy efficiency than conventional fossil fuel combustion systems using city gas.
*43 Our own calculation based on information*44 in METI's "Top Runner Program".
*44 METI's Top Runner Program for Gas Water Heaters

■Avoided CO2 emissions mechanism:
Avoided emissions are the difference between the direct CO2 emissions from fuel combustion in a gas system and the indirect CO2 emissions (calculated from the amount of power consumed in an electric HP system) over their lifetimes (10 years).
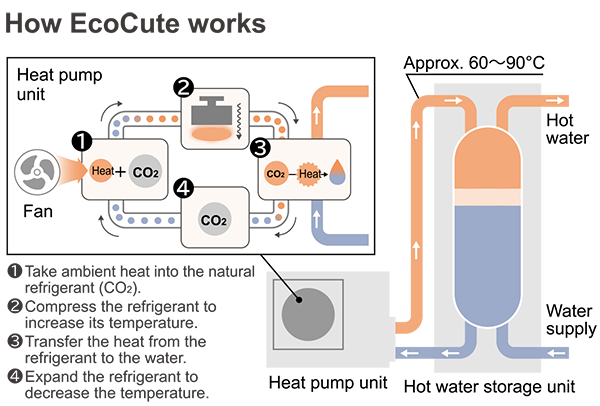
■Baseline scenario: (Simulation without this product)
Gas water heater would remain in use in Japan, and gas boilers/heaters would remain in use in Europe until the end of product life (assumption).
■Baseline: (Subject to comparison)
(EQ) CO2 emissions*44 of a standard gas water heater on the market (A2W) CO2 emissions from existing gas water heater/heaters
■Coverage of quantification: (System boundary)
The difference in the CFPs* for both the HP system and the gas system.
The HP system also showed less CO2 emissions when not in use; however, the difference between the CO2 emissions from the HP system and the gas system when not in use is smaller than the difference when in use.*45 We decided not to add the non-use difference to the avoided emissions to retain a conservative viewpoint in quantification.
*45 1 to 3% of the avoided emissions (actual results for Panasonic in FY2026)

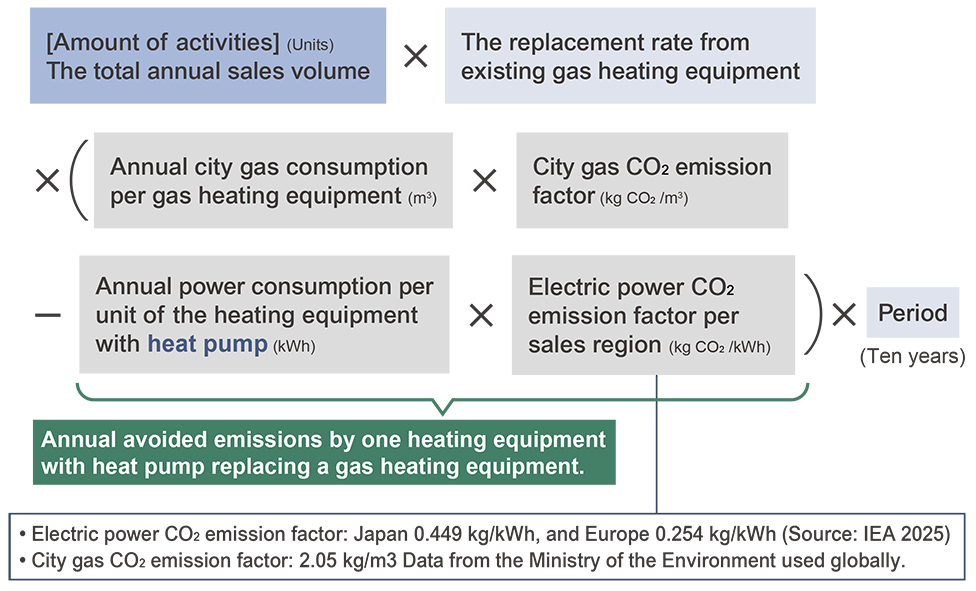
■Calculation formula:

■Amount of activities: (Regional sales unit per product group)
EcoCute: The number calculated by the following equation: the annual sales volume in Japan x 70%*47 which is the replacement ratio of gas heating equipment with heating equipment with heat pump.
- *47 Our own calculation based on data from the Japan Refrigeration and Air Conditioning Industry Association (JRAIA).
A2W: The number of annual sales of A2W in Europe (Unit)*48
- *48 We deemed that replacement ratio of old A2Ws with new ones can be ignored as the sales started in 2008.
■Period: (Flow method: Include entire lifetime CO2 emissions of the product in its first sales year)
- 10 years (The holding years of repair parts.)
CO2 emissions reduction effect continues during that period. (Assumption)
■Fiscal 2026 avoided emissions: 2 million tons
*CFP (Carbon Footprint of Products): CO2 emissions converted from GHG emissions throughout the entire product life cycle—from raw material procurement to disposal and recycling of a product and service (per one unit).
Device Field
Cylindrical Lithium-ion Batteries for In-vehicle Use
Main product life stages subject to avoided CO2 emissions
Sales regions: North America
■Product overview:
Compared with Internal Combustion Engine (ICE) vehicles, Electric Vehicles (EVs) have better energy efficiency*49 and lower CO2 emissions throughout their lifecycles. Among EVs, Battery Electric Vehicles (BEVs) are propelled by all-electric motor rotation. The batteries used in BEVs are regarded as one of their most important components as they are equivalent to the fuel supply in ICE vehicles.
■Avoided CO2 emissions mechanism:
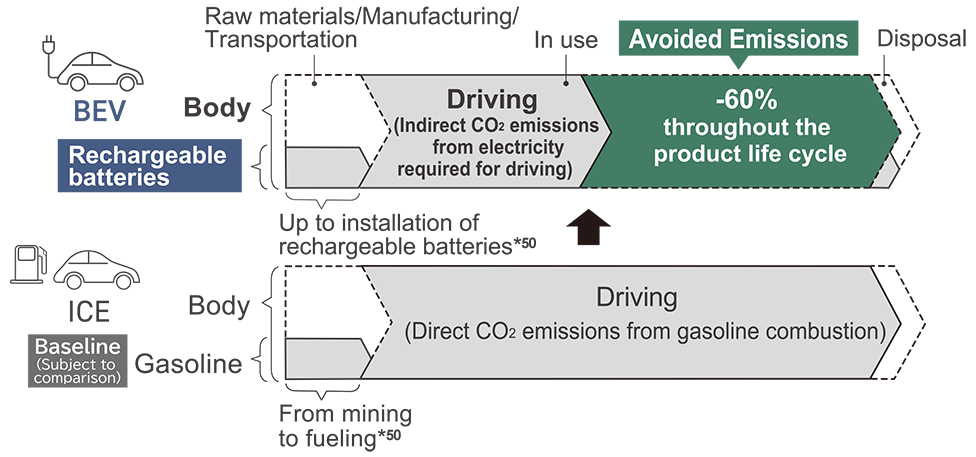
By running a BEV with Panasonic rechargeable batteries and an ICE vehicle over the same distance, calculate the CO2 emissions equivalent to the power consumed by the BEV and the CO2 emissions from fuel combustion in the ICE.
When comparing these CO2 emissions, there would be a difference because the BEV has better energy conversion efficiency.
Conversion Ratio from energy consumption to driving force*49

■Baseline scenario: (Simulation without this product)
An assumption based on an average ICE vehicle in the U.S. used over its deemed lifetime mileage
■Baseline: (Subject to comparison)
CO2 emissions from an average ICE vehicle in the U.S. over its entire product lifecycle, including fuel production and usage.
■Coverage of quantification: (System boundary)
The difference between the total CO2 emissions from the BEV and the ICE vehicle. The total CO2 emissions cover the entire lifecycle of the respective vehicles, from the stage of raw material mining to disposal and recycling, including usage over the same lifetime mileage.
Reference: ICCT (The international council on clean transportation)

*50 Between a BEV and an ICE vehicle, their manufacturing processes, including raw material procurement, production, transportation, are different, because the BEV uses a rechargeable battery and the ICE would require fuel, which needs to be mined in advance. However, despite such differences, the length of arrows for the two vehicles have the same lengths (and the difference in lifecycle CO2 emissions remains △60%).
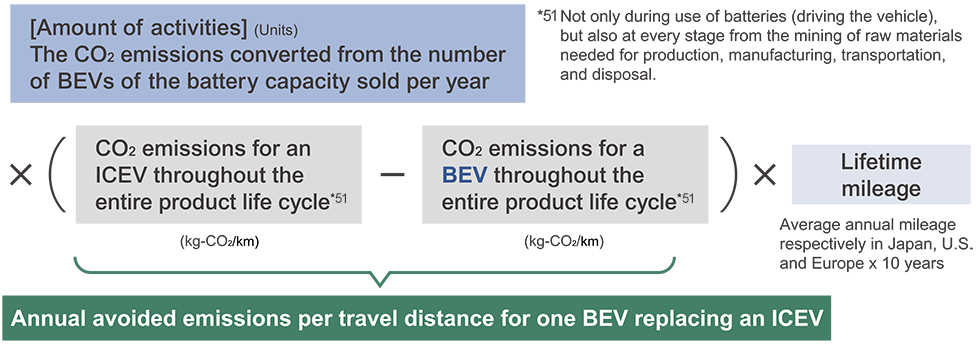
■Calculation formula:

■Amount of activities: (Unit)
CO2 emissions converted from the number of sold cylindrical lithium-ion batteries for in-vehicle use per year to the number of BEVs.
■Period: (Flow method: Include entire lifetime CO2 emissions of the product in its first sales year)
Lifetime travel distance.
- Average annual travel distance respectively in Japan, U.S. and Europe*52 x Vehicle life (10 years)
- CO2 emissions reduction effect continues during that period.
*52 Assuming that vehicles equipped with cylindrical lithium-ion batteries are sold on the global market, we used the average for the three regions.
The Shipping Quantity of Cylindrical Lithium-Ion Batteries for In-Vehicle Use
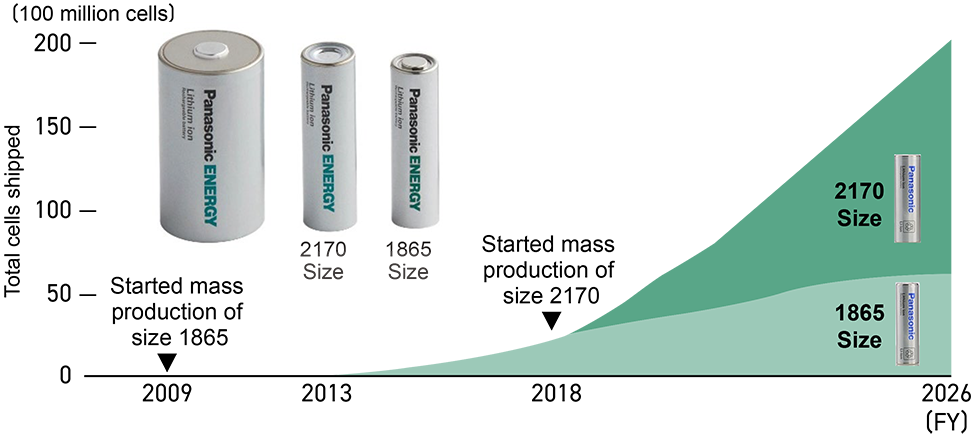
Device Field
DC*53 Fan Motor for Energy Saving in Air Conditioning Systems
*53 Direct Current (DC)
Main product life stages subject to avoided CO2 emissions
Sales regions: China, Southeast Asia, Europe, North America
■Product overview:
The fan motor is an indispensable component that determines the performance of an air conditioner.
Although the motor's power consumption is less than 10% of that of the entire air conditioner, the fan motor saves energy over its lifetime while being used by a customer, and directly contributes on CO2 emissions reduction.
Compared to an Alternating Current (AC) motor, a Direct Current (DC) motor can be operated optimally for a given load, thereby consuming energy more efficiently.
■Avoided CO2 emissions mechanism:
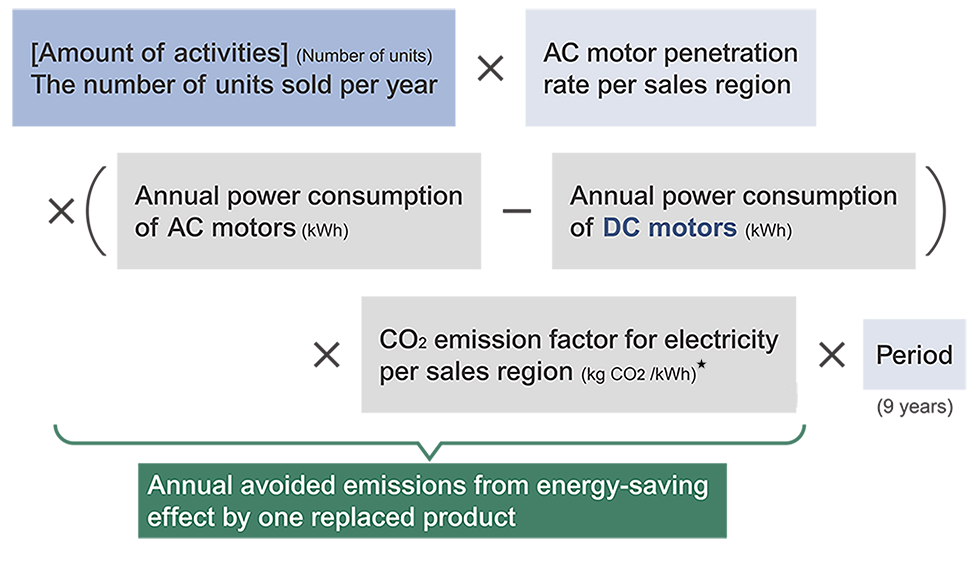
The difference between converted CO2 emissions equivalent to the power consumption of an AC motor and a DC motor are the avoided emissions.
Example
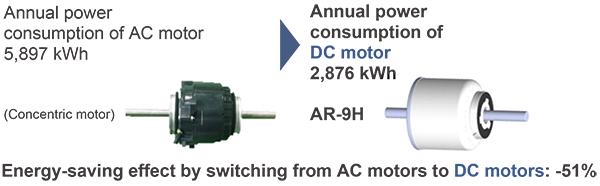
Outdoor unit for a multi-split air conditioning system for buildings, equipped with a DC motor. (Image of our product)
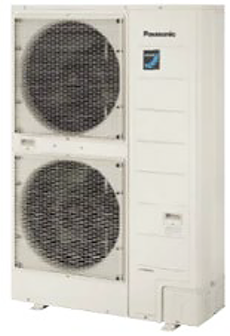
■Baseline scenario: (Simulation without this product)
Air conditioning equipment equipped with AC motors is used throughout its product lifespan. (Assumption)
■Baseline: (Subject to comparison)
Lifetime CO2 emissions from an AC motor that drives the fan in an air conditioner
■Coverage of quantification: (System boundary)
The difference between CFPs* of an AC motor and a DC motor. The CFP difference when not using the two motors was excluded from the data by our decision. This was because the average 80 to 90% CFP from an electric appliance, including the motor, is derived from its usage, and the CFPs of the two motors when not in use are equivalent.
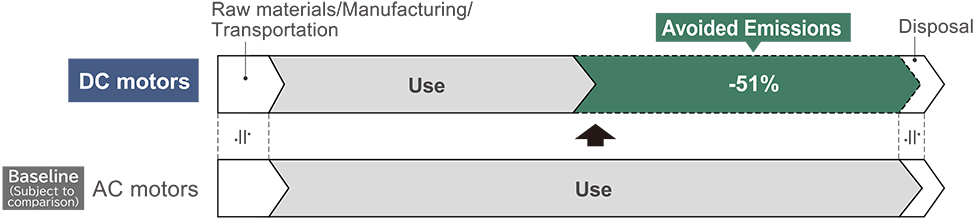
■Calculation formula:

★CO2 Emissions Factor from Electricity
(IEA2025)
Unit: kg/kWh
■Amount of activities: (Unit)
Annual sales in each sales area (penetration rate, etc.), also taking account of the pre-DC motor period sales.
■Period: (Flow method*54)
- 9 years. (Product life defined by us) The CO2 emissions reduction effect continues during the period.
- We deemed that 9 years for holding spare parts is a conservative estimate as the life of home appliances can be extended with appropriate use and maintenance.
- The CO2 emissions reduction effect is assumed to continue during the period.
- With the extended product life, further CO2 emissions reduction effects are also expected because of efficient utilization of resources.
*54 Include entire lifetime CO2 emissions of the product in its first sales year
■Fiscal 2026 avoided emissions: 8 million tons
*CFP (Carbon Footprint of Products): CO2 emissions converted from GHG emissions throughout the entire product life cycle—from raw material procurement to disposal and recycling of a product and service (per one unit).
Solution Field
Heat Exchange System
Main product life stages subject to avoided CO2 emissions
*55 Reduction in CO2 emissions from reducing air conditioning heat loss from room spaces during the period of use of the products.

Sales regions: Japan, China, North America, and Europe
■Product overview:
Our heat exchange system exchanges the ambient heat between the interior and exterior air during ventilation.
By either heating or cooling the exterior air using a heat exchange element before sending it into the interior, the system reduces the air conditioning load. The system is also equipped with an air purifier to maintain good air quality, and is thus capable of reducing heat loss in rooms while also delivering air purity. The system can be widely adopted in houses, shops, and buildings where high air tightness (insulation) is required across many countries, including Japan, China, the U.S. and Europe.
■Avoided CO2 emissions mechanism:
CO2 emissions converted from the reduced amount of power or fuel consumption by adopting this ERV★ System in room spaces under the same conditions compared to those from average ventilation method for ventilation in the market.
★ Energy Recovery Ventilation
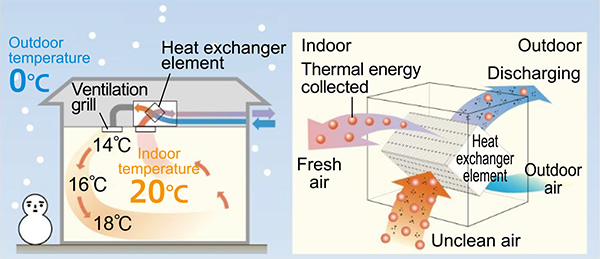
How ERV System works (winter)
■Baseline scenario: (Simulation without this product)
The use of air conditioners in a residential house where the current average ventilation systems in the market (Assumption)
■Baseline: (Subject to comparison)
CO2 emissions converted from power and fuel consumption per each sales region from the use of air conditioners in a residential house where the current average ventilation systems in the market are installed.
■Coverage of quantification: (System boundary)
Difference in the heating and cooling load of the house before and after installation of the heat exchange system (this product). The CFP* for this product is bigger than for a conventional ventilation system; however, the equivalent CO2 emissions from the difference in the heating and cooling load in a residential house before and after installation of a heat exchange air system is small (our calculation). Therefore, we decided that the effect can be ignored.
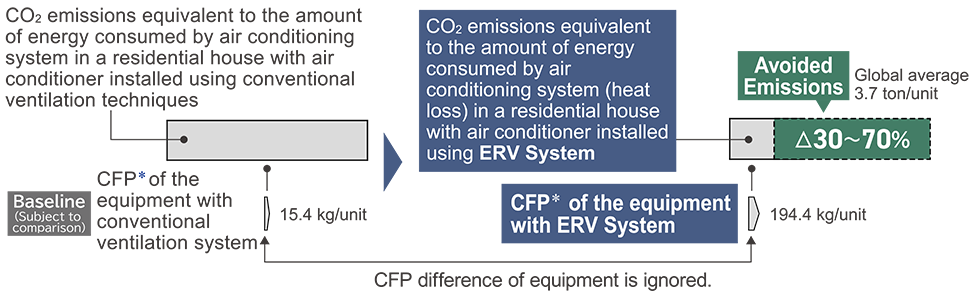
■Calculation formula:

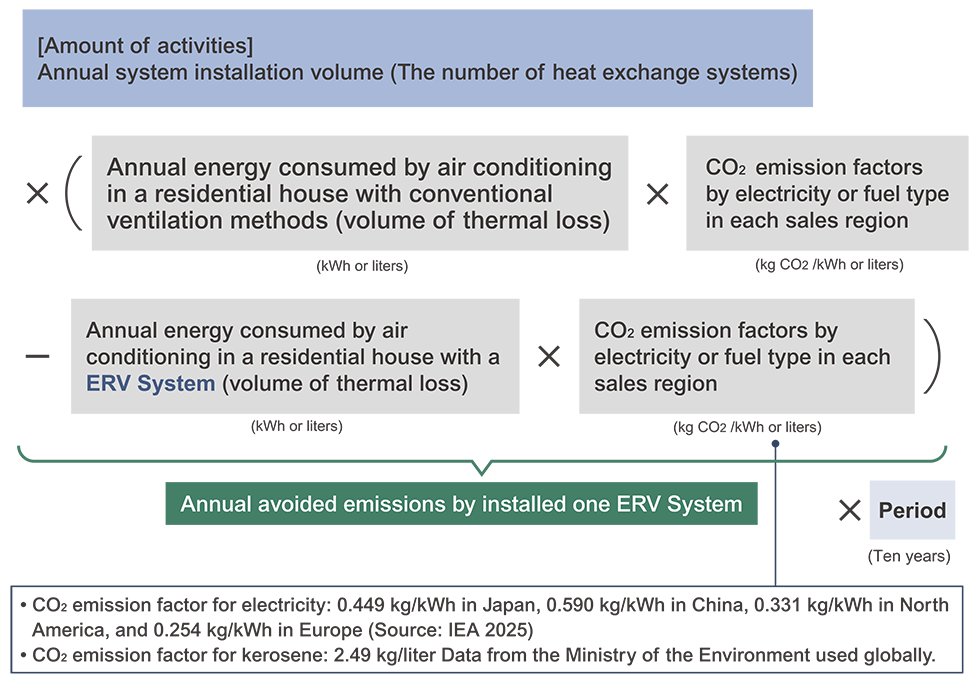
■Amount of activities: (Unit)
The number of annual sales of heat exchange units, which is the core function of the system.
■Period: (Flow method: Include entire lifetime CO2 emissions of the product in its first sales year in one time.)
- Designed lifetime of ERV System (10 years)
- CO2 emissions reduction effect continues during the period.
■Fiscal 2026 avoided emissions: 0.7 million tons
*CFP (Carbon Footprint of Products): CO2 emissions converted from GHG emissions throughout the entire product life cycle—from raw material procurement to disposal and recycling of a product and service (per one unit).
Device Field
Distributed Storage Battery System for Data Centers
Main product life stages subject to avoided CO2 emissions
*56 Reduction of CO2 emissions in data centers during the period of use of the products

Sales regions: North America
■Product overview:
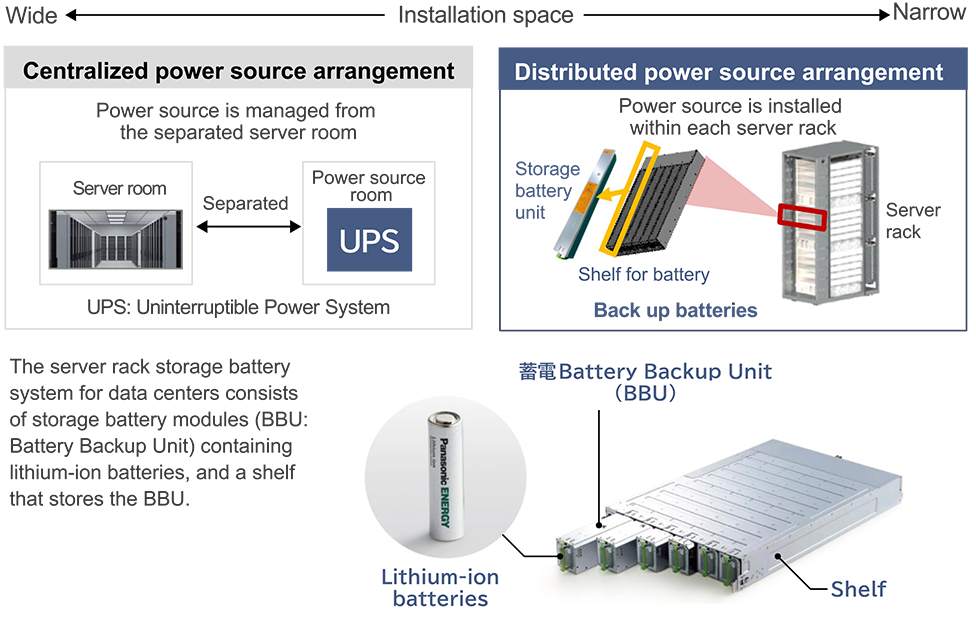
Electricity demand from data centers is rapidly increasing due to the spread of high-performance servers for AI use. Stabilizing power supply is now indispensable to reduce peak power demand and avoid momentary power outages. In our distributed power supply system using lithium-ion batteries, a power supply unit is located at each server rack. This is both space saving and also offers better power supply efficiency by reducing the number of voltage conversions to the servers compared with conventional lead-acid batteries.
■Avoided CO2 emissions mechanism:
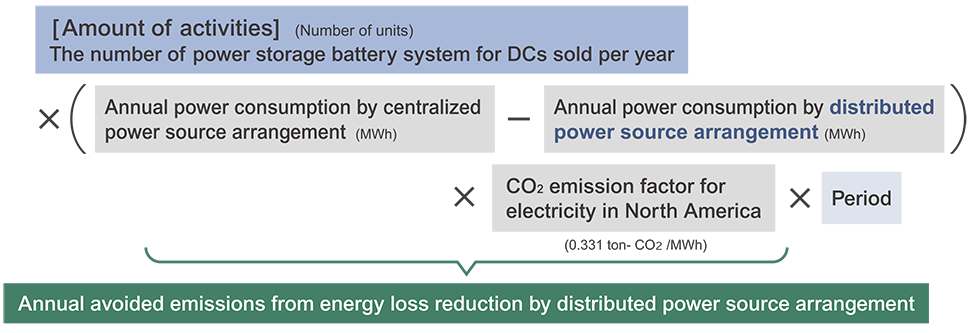
The calculation assumed the same load of computing is operated in two data centers, one equipped with a distributed power supply system and the other with a central power supply system. The avoided emissions are equivalent to the reduced power consumption achieved by the voltage conversion loss reduction.
■Baseline scenario: (Simulation without this product)
A data center with a central power supply system that operates a certain level of computing load.
■Baseline: (Subject to comparison)
CO2 emissions equivalent to the power consumption required for the data center with a central power system to operate the said level of computing load for a certain period.
■Coverage of quantification: (System boundary)
Determine the power consumption required via the power supply systems for a data center to operate at a specified level of computing load. Then determine the difference in voltage conversion loss between the centralized power supply system with lead-acid batteries and the distributed power supply system with lithium-ion batteries. Calculate the CO2 emissions equivalent to the loss difference.
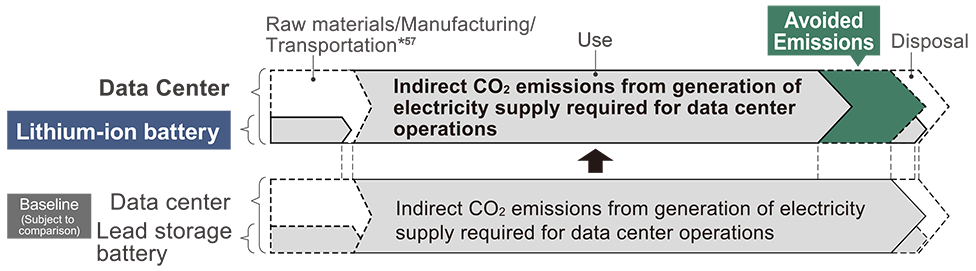
*57 A lithium-ion battery's CFP (1.6 kg/kWh) is about 80% of a lead storage battery's CFP (2 kg/kWh). This difference was not included in the avoided emissions to retain a conservative viewpoint in quantification.
[Reference] LCAs of lithium-ion batteries and lead storage batteries
■Calculation formula:

■Amount of activities: (Unit)
The annual sales of distributed storage battery systems containing lithium-ion batteries installed in DCs.
■Period: (Flow method: Include entire lifetime CO2 emissions of the product in its first sales of the year)
Designed product life. CO2 emissions reduction effect continues during the period.
【Reference】About distributed storage battery system for data centers
*CFP (Carbon Footprint of Products): CO2 emissions converted from GHG emissions throughout the entire product life cycle—from raw material procurement to disposal and recycling of a product and service (per one unit).
Smart Life Field
Electrically-Assisted Bicycle

Main product life stages subject to avoided CO2 emissions

Sales regions: Japan
■Product overview:
An electrically-assisted bicycle provides auxiliary power via a motor driven by pedaling. It is a means of transportation mainly achieved by human pedaling but with the help of a motor that reduces the physical burden of going uphill and carrying a load.
■Avoided CO2 emissions mechanism:
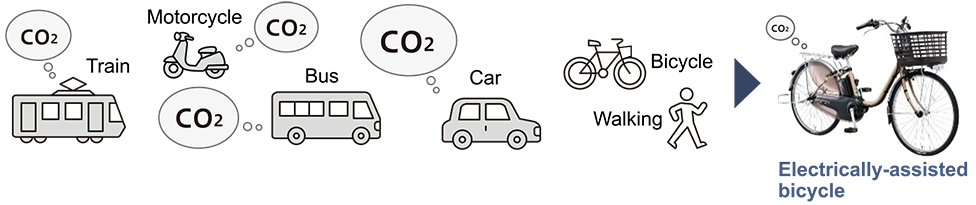
The difference between the CO2 emissions equivalent of the electricity consumed by a train and the CO2 emissions from the combustion of fossil fuels by a motorcycle, bus, or car—all moving the same distance—and the CO2 emissions equivalent of the electricity consumed by an electrically-assisted bicycle is calculated as the avoided emissions. The CO2 emitted by a bicycle and walking*58 are subtracted.
*58 CO2 emissions from walking are deemed to be zero.
■Baseline scenario: (Simulation without this product)
Means of transportation (train, motorcycle, bus, car, bicycle, and walking) that move the same distance as the electrically-assisted bicycle (Assumption)
■Baseline: (Subject to comparison)
CO2 emissions from moving the above distance by train, motorcycle, bus, and car (zero emissions from a bicycle and walking)
■Coverage of quantification: (System boundary)
The difference between the CO2 emissions from the average lifetime mileage of an electrically-assisted bicycle and that from a train, motor bike, bus, and car
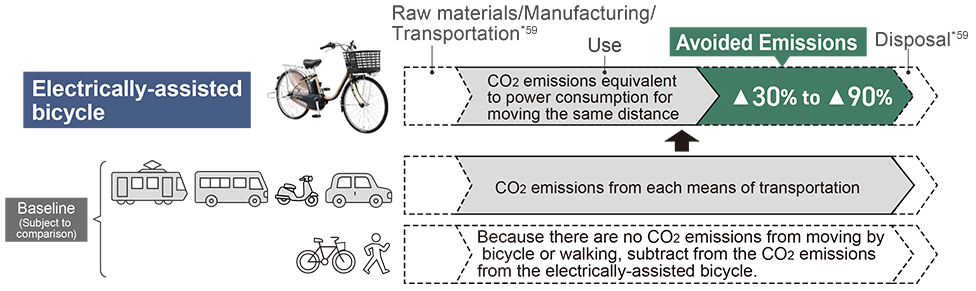
*59 After analyzing the lifecycle CO2 emissions of each means of transportation other than actual moving, these CO2 emissions were excluded from the comparison due to the following reasons:
- CO2 emissions from a bicycle and an electrically-assisted bicycle are equivalent, and CO2 emissions from walking are impossible to calculate.
- The difference between the material volume used in an electrically-assisted bicycle and a train, bus, motor bike, or car is extremely large. Also, the difference between the lifetime mileages of an electrically-assisted bicycle and that of the other means of transportation is too large to compare.
■Calculation formula:

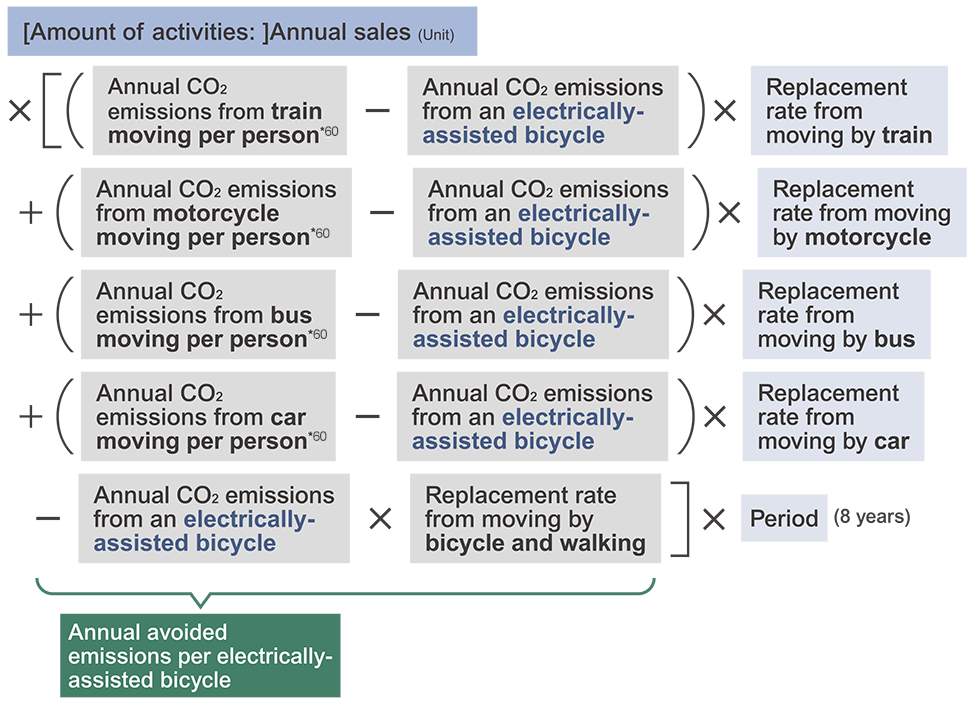
*60 Annual CO2 emissions: The data related to a train, motorcycle, bus, and car was based on the Lifecycle Inventory Database IDEA Ver.3.4 managed by Sustainable Management Promotion Organization (SuMPO). Annual CO2 emissions from an electrically-assisted bicycle was calculated by us.
■Amount of activities: (Unit)
Number of annual sales of electrically-assisted bicycles
■Replacement rate: (Unit)
Specified according to means of transportation in surveys conducted to purchasers of electrically-assisted bicycles fiscal 2024 model. (Right table)★
- Survey period: July 2023 to August 2024
- Effective answers: 4,836
■Period: (Flow method*61)
*61 Include entire lifetime CO2 emissions of the product in its first sales of the year
- Electrically-assisted bicycle life (8 years)
- CO2 reduction effects continue during the period (assumption)
■Fiscal 2026 avoided emissions: 168 thousand tons
★Means of Transportation Before Purchase of an Electrically-Assisted Bicycle, and Its Percentage (Replacement Rate)
Means of Transportation Before Purchase of an Electrically-Assisted Bicycle, and Its Percentage (Replacement Rate)
Note: The figure for purchase electrically-assisted bicycles indicates the percentage of purchasers who had already owned or used electrically-assisted bicycles.

High Concentration Cellulose Fiber Molding Material, kinari
Main product life stages subject to avoided CO2 emissions

Sales regions: Japan
■Overview:
The production volume of petroleum-derived plastic (hereafter, resin) is expected to increase to 610 million tons by 2030 from 450 million tons in 2020*62. However, its recycling rate is limited to 9%*63, posing a challenge in terms of waste recycling and carbon neutrality. For 20 more years in Japan, Panasonic has been recycling the home appliances that we produced, promoting recycling-oriented manufacturing. However, the single resin (high purity and quality) that can be manually collected from waste home appliances is limited to 20% of the entire resin used in a product. Also, much of the mixed resin (low purity and medium quality) collected by machine shredding cannot be used for new products.
One of the solutions to this issue is replacing the resin components with bio resin, which is made from corn and other materials. Nonetheless other problems still remain, such as the impact on food production and occasional issues with functionality. Our high concentration cellulose fiber molding material, kinari, is made from plant-based materials such as forest thinning timber and industrial wastes, and has a competitive advantage due to its better density, strength, and price compared to other fiber materials. Kinari can contain up to 85% cellulose fiber, yet it is lighter than petroleum-derived resin. It can also be shaped by existing molding machines. Increasing use of kinari should contribute to building a circular economy and achieving carbon neutrality.
*62 Bioplastics 2020-2025 (IDTechEx Report)
*63 Production, use, and fate of all plastics ever made | Science Advances
■Avoided CO2 emissions mechanism:
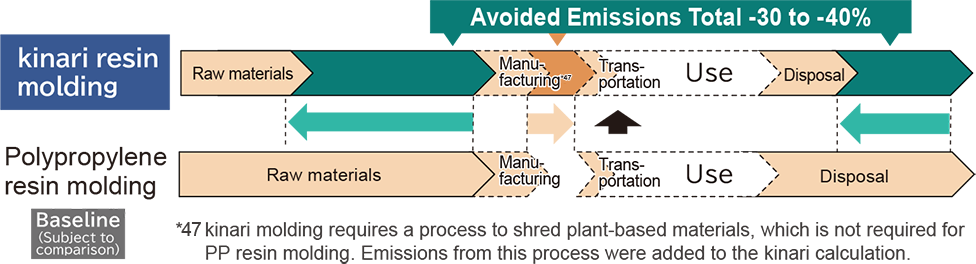
Compared to a standard petroleum-derived resin molding, a kinari molding can offer a CO2 emissions reduction effect in the phases of material procurement and molding disposal. Although kinari requires the shredding of plant materials*64, even taking account of the impact from such shredding, kinari molding’s CO2 emissions across its life cycle are smaller than those from petroleum-derived molding.
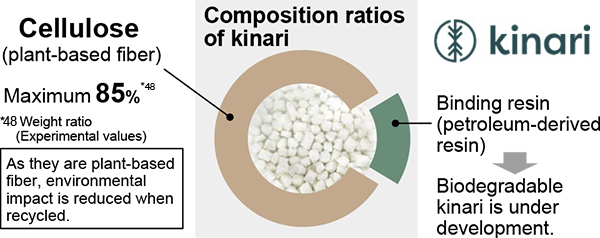
CO2 emissions of petroleum-derived resin and kinari
(CFP* comparison between molding product)
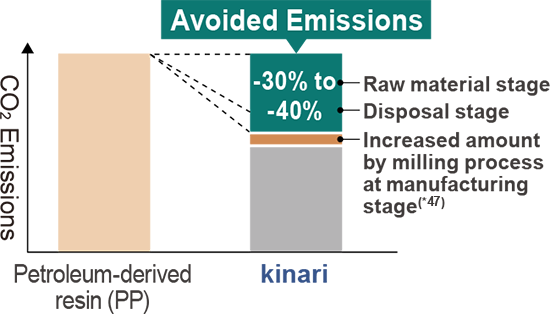
Baseline: (Subject to comparison)
CFP* for standard polypropylene resin molding.
Coverage of quantification: (Concept and rationalization)
The difference in CO2 emissions between kinari and the baseline must be determined covering the phases of material procurement, production, transportation, and disposal. However, we did not include the phases of production, transportation, and usage for quantification. This was because the difference in emissions during use was zero, and the production and transportation processes are identical for both kinari and the baseline.
■Calculation formula of avoided emissions:

![[Amount of activities] The number of kinari packages sold per year (1 pack: 25 kg) * (CFP* for standard polypropylene resin molding (Calculated under the SuMPO EPD program) - CFP* for kinari resin molding (Including the amount of carbon stock of kinari at disposal.)) * 1 (once)Reduction effect takes place once in a molding’s life cycle.](/content/dam/holdings/global/en/corporate/sustainability/environment/vision/eco-vision_i_03.png)
■Amount of activities: (Unit)
The number of kinari packages sold per year (1 pack: 25 kg)
■Avoided CO2 emissions per unit of amount of activity: (Latest basic unit)
The difference between CO2 emissions*66 across the life cycle of a standard PP resin molding and that of a kinari molding.
*66 Figures calculated by us based on the SuMPO EPD program.
The calculations took account of the amount of carbon stock of kinari at disposal.
■Period: Once
Reduction effect takes place once in a molding’s life cycle.
■Avoided CO2 emissions in fiscal 2026 : 12.7 tons
Petroleum-based plastic reduction in fiscal 2026 : 3.2 tons

*CFP (Carbon Footprint of Products): CO2 emissions converted from GHG emissions throughout the entire product life cycle—from raw material procurement to disposal and recycling of a product and service (per one unit).
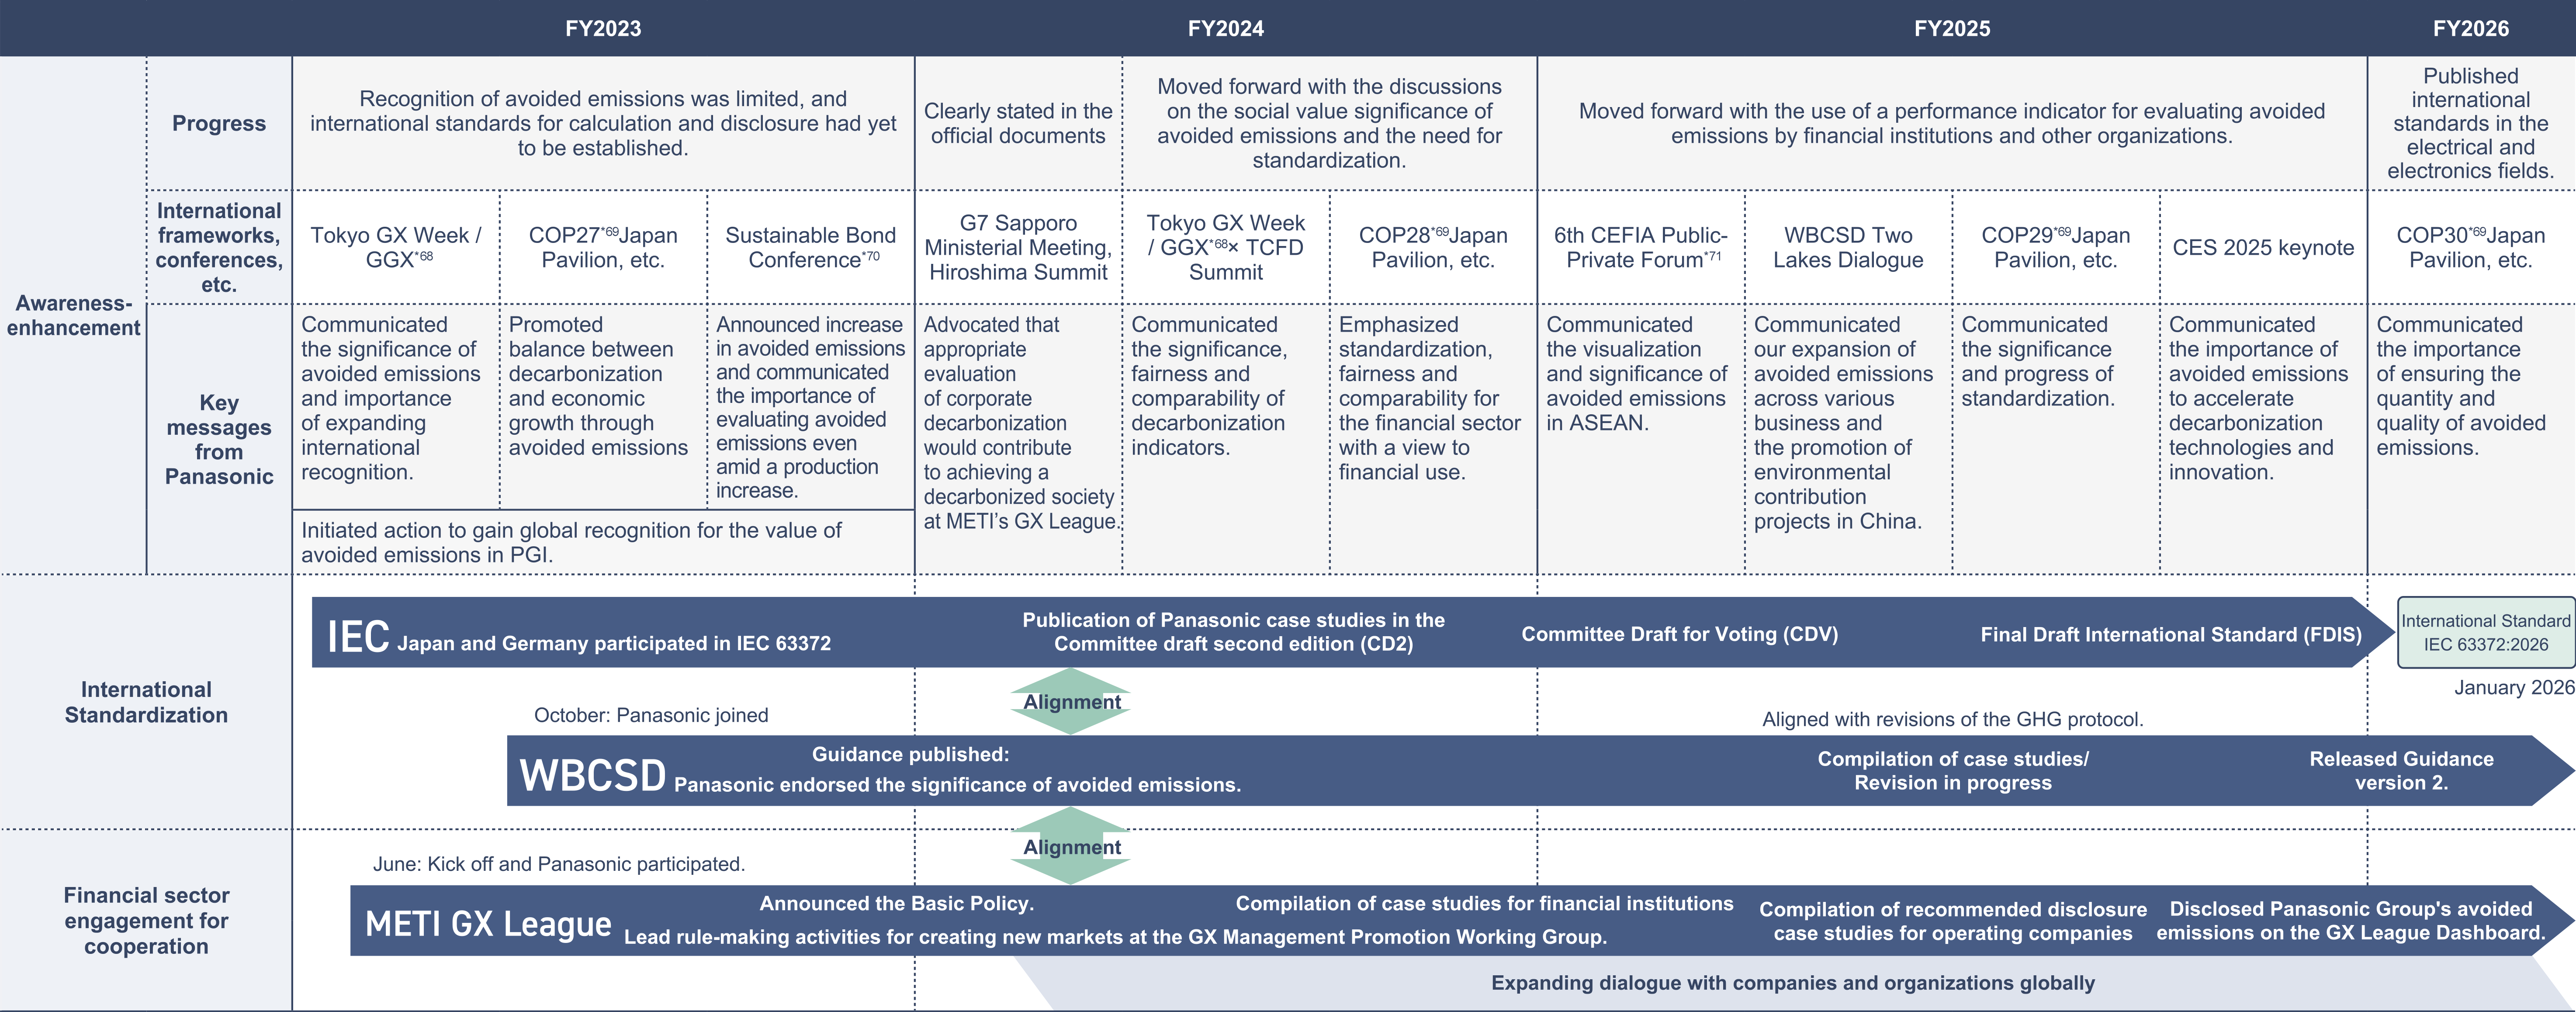
Initiatives to raise awareness of and enhance the recognition of avoided emissions
While established frameworks exist for assessing greenhouse gas (GHG) emissions associated with a company's business activities, they do not fully capture its contribution to decarbonization across society through those activities, that is, the opportunity side of climate action. Although the concept of avoided emissions is becoming widespread, internationally unified standards and a disclosure system that enables data comparison are still under development. In this situation, it is important to build an environment in which companies' contributions to decarbonization are properly evaluated while advancing technological development and innovation.
Panasonic GREEN IMPACT, our long-term environmental vision, is designed to value not only our own contributions to CO2 emissions reduction, but also those of society as a whole. We regard avoided emissions as one indicator of a company's contribution to decarbonization.Based on this view, we work with companies, financial institutions, and international organizations that share the same ambitions. Through this collaboration, we contribute to international standardization efforts, raise awareness, and promote practical implementation.In doing so, we seek to create an environment that drives the decarbonization of society as a whole and enables appropriate evaluation of avoided emissions in the capital market.To this end, we advance standardization, social implementation, and financial sector engagement in an integrated manner, with the aim of translating avoided emissions into financial value and enhancing corporate value.
Standardization Activities
International Electrotechnical Commission (IEC)
The international standardization of avoided emissions, to which we have contributed, has progressed, and IEC 63372, covering electrical and electronic products and systems, was published in January 2026. This international standard addresses quantification and communication of carbon footprints, GHG emission reductions, and avoided emissions of electrical and electronic products and systems. It clarifies important points within the actual quantification and communication, including reporting avoided emissions separately from the company's own GHG inventory emissions, determining baselines, defining system boundaries, and avoiding double counting for GHG data. As a member of the international committee, we contributed to the development of the standard, including by providing calculation examples.
World Business Council for Sustainable Development (WBCSD)
WBCSD is a global organization of approximately 200 leading companies committed to sustainable development, working together to accelerate the transition to a sustainable world. Endorsing the principles of WBCSD, Panasonic Holdings Corporation (PHD) joined WBCSD in 2022 to accelerate the Panasonic Group's PGI activities. Following the publication of Guidance on Avoided Emissions in 2023, WBCSD has been working on an updated version of the guidance and developing sector-specific guidance. As a member of WBCSD, we also participate in discussions concerning such revisions and their implementation. WBCSD helps connect the concept of avoided emissions with corporate practices and dialogue with the financial sector. We also work with other member companies and relevant stakeholders to improve the credibility of avoided emissions and promote their wider adoption.
International Organization for Standardization (ISO) and Greenhouse Gas Protocol (GHG Protocol)
In fiscal 2025, significant progress was also made within ISO and GHG Protocol. Under their strategic partnership, ISO and the GHG Protocol are working to integrate the revision of ISO 14064-1: Greenhouse gases - Part 1: Specification with guidance at the organization level for quantification and reporting of greenhouse gas emissions and removals with the GHG Protocol's corporate standards into harmonized, co-branded international standards. Within the GHG Protocol's Actions and Market Instruments (AMI) discussions, work is under way on a framework for transparently reporting decarbonization impacts on society, including avoided emissions. Through alignment across the IEC standard, WBCSD guidance, ISO, and the GHG Protocol, we aim to create an enabling environment in which avoided emissions can be used as a transparent and comparable indicator. This will support corporate disclosure of contributions to decarbonization, dialogue with financial institutions, and broader societal understanding of such contributions.
GX League*67
To establish a system whereby the opportunities for Japan's corporations contributions to climate change, such as by reducing emissions from the products and services they provide to the markets, are properly evaluated, Panasonic has participated as a leading member of the GX Business Working Group since its inception, in the area of rulemaking for market creation that is one of the GX League activities.
To expand awareness of the avoided emissions that is one of the disclosure items used in the Panasonic Group's long-term environmental vision in evaluating opportunities related to climate change, we jointly published with other GX league member company a collection of use examples by financial institutions in December 2023, and in May 2024 a virtual collection of recommended information disclosure by our operating companies, following to "the Basic Policy for disclosure and evaluation for opportunities related to climate change" published in fiscal 2023. We disclosed a sample calculation of avoided emissions on the GX Dashboard.
*67 GX stands for 'Green Transformation'. In February 2022, the Industrial Science and Technology Policy and Environment Bureau of the Ministry of Economy, Trade and Industry (METI) announced the GX League Basic Concept. GX League was launched as an apparatus where the company groups who are proactively working for GX with players in industry, government, academia and financial institutions challenge towards GX as a whole to discuss transformation of a whole society, economic and environmental system and implement activities to create new markets.
Appeal of the avoided emissions at international events
As a result of our fiscal 2023 activities for raising awareness and dissemination of the avoided emissions at international events, the activities were clearly stated in the 2023 G7 outcome documents. We have continued working to raise awareness and valorize the avoided emissions in fiscal 2026.
COP30 (The 2025 Conference of the Parties of the United Nations Framework Convention on Climate Change (UNFCCC))
In November 2025, the Panasonic Group participated in the seminar, "Turning Avoided Emissions into Corporate Value—Paving the Way for Practical Action," organized by the Ministry of Economy, Trade and Industry (METI) in the COP30 Japan Pavilion. We presented the three steps that corporations should take for disclosure: standardizing the calculation processes; collecting concrete examples of calculations; and disclosure of calculation results based on standardization. We also mentioned that one current challenge is that only a limited number of corporations disclose avoided emissions. Therefore, it is essential to increase the quantity and quality of avoided emissions disclosures so that they are properly valued by stakeholders. We also introduced the Avoided Emissions Platform, a global database of avoided emissions impact, in which we participate.
Initiatives to Enhance Awareness, Standardization and Financial Sector Engagement for Cooperation with Avoided Emissions
*68 GGX: Global Green Transformation Meeting
*69 COP27 (November 2022, Egypt), COP28 (November 2023, UAE), COP29 (November 2024, Azerbaijan), and COP30 (November 2025, Brazil)
*70 Co-hosted with the International Capital Market Association (ICMA) and the Japan Securities Dealers Association
*71 Cleaner Energy Future Initiatives for ASEAN (CEFIA) is a public-private partnership framework platform led by METI to promote decarbonization in Asia. The 6th Public-Private Forum, Session 6 (Bangkok, Thailand)
